Form revised February 6, 2008
FISCAL NOTE FOR NON-CAPITAL PROJECTS
|
Department: |
Contact Person/Phone: |
DOF Analyst/Phone: |
|
City Light |
Marilynn Semro/ 206-386-4539 |
Karl Stickel/ 206-684-8085 |
Legislation Title:
|
AN ORDINANCE relating to the City Light Department; authorizing execution of a 20-year agreement with WM Renewable Energy, LLC for the purchase of renewable power and environmental attributes and other related agreements that are necessary or convenient for transmitting the power from the Columbia Ridge landfill.
|
· Summary of the Legislation:
This legislation approves a 20-year renewable power purchase for Seattle City Light (‘SCL’) to receive electrical output and environmental attributes from the new Columbia Ridge Landfill electric generating facility (‘Columbia Ridge’ or ‘Facility’) located in the City of Arlington, Gilliam County, Oregon.
· Background: (Include brief description of the purpose and context of legislation and include record of previous legislation and funding history, if applicable):
Columbia Ridge can produce 6.4 MW of electrical output and SCL will purchase the energy in excess of station service and the preparation of the landfill gas or about 5.8 average MW (‘aMW’) annually. City Light will receive all of the environmental attributes associated with the 6.4 MW of electrical output. This Facility is expected to have a capacity factor in excess of 95%. The Facility is currently in the design stages. Test power is expected in September 2009 with an on-line date expected in October 2009. There is a positive net present value to SCL in excess of $11 million associated with the acquisition of this resource. Columbia Ridge is an eligible renewable resource under Washington State’s Energy Independence Act (Chapter 19.285 RCW) and complies with Washington State’s greenhouse gas emissions rules for base load generation (Chapter 80.80 RCW).
Additional features of this agreement include the following:
- This contract is conditional upon WM receiving a Generator Interconnection Agreement with Columbia Basin Electric Cooperative and an Integration Agreement with the Bonneville Power Administration that is reasonably acceptable to them as to form, substance and cost. (Section 2.3.2 and 2.3.3 of the Power Purchase Agreement (PPA)).
- This agreement is the culmination of a joint effort between SCL and Seattle Public Utilities (‘SPU’) and is tied to their agreement with Waste Management of Washington. This PPA terminates on March 31, 2028. However, WM Renewable Energy, LLC (‘WM’) has the right to terminate this agreement with SCL if SPU terminates their April 7, 2008 agreement with Waste Management of Washington, Inc. (‘WMW’). Notice of termination by SPU to WMW must be 6 months prior to March 31, 2019 and notice to SCL must be within 30 days after receipt of notice by WMW from SPU. If SPU does not exercise their option to terminate in 2019, the next opportunity by SPU to terminate will be March 31, 2021. (Section 2.5.2.2 PPA).
- If WM decides to expand the generation at the Facility, this contract provides an exclusive window for SCL to negotiate the purchase of the additional output. (Section 3.6 of PPA).
- WM is guaranteeing output of 44,500 MWh per year less any force majeure events. This is, in effect, guaranteeing an 88% capacity factor. Delivery of less than 44,500 MWh as adjusted will require WM to pay SCL for replacement power and renewable energy credits that meet I-937 requirements. (Article 6 of PPA).
- Enhanced operating procedures reflecting expanded North American Electric Reliability Corporation and the Western Electric Coordinating Council requirements are provided in a separate exhibit for ease of use by operating personnel. (Exhibit H of PPA).
- The output of the Facility will be dynamically scheduled to SCL’s balancing authority. (Exhibit H of PPA).
The acquisition of this resource meets the requirements set forth in SCL’s 2008 Integrated Resource Plan to purchase 6 aMW of new baseload renewable resource by 2010. In addition, this resource will help SCL meet the requirements of Washington State’s Energy Independence Act also known as I-937.
· Please check one of the following:
____ This legislation does not have any financial implications. (Stop here and delete the remainder of this document prior to saving and printing.)
__X__ This legislation has financial implications. (Please complete all relevant sections that follow.)
Appropriations: This table should reflect appropriations that are a direct result of this legislation. In the event that the project/programs associated with this ordinance had, or will have, appropriations in other legislation, please provide details in the Notes section below.
|
Fund Name and Number |
Department |
Budget Control Level* |
2008 Appropriation |
2009 Anticipated Appropriation |
|
|
|
|
|
|
|
TOTAL |
|
|
|
|
*See budget book to obtain the appropriate Budget Control Level for your department.
Notes: Money has already been appropriated in the 2009 and 2010 budgets for this resource. No additional appropriations are being requested.
Anticipated Revenue/Reimbursement: Resulting From This Legislation: This table should reflect revenues/reimbursements that are a direct result of this legislation. In the event that the issues/projects associated with this ordinance/resolution have revenues or reimbursements that were, or will be, received because of previous or future legislation or budget actions, please provide details in the Notes section below the table.
|
Fund Name and Number |
Department |
Revenue Source |
2008 Revenue |
2009 Revenue |
|
|
|
|
|
|
|
TOTAL |
|
|
|
|
Notes: While no separate budget item was included for the revenue potential for this resource, it is implicitly included in the Power Management’s wholesale revenue forecast to the extent it is not being used to serve load.
Total Regular Positions Created, Modified, Or Abrogated Through This Legislation, Including FTE Impact: This table should only reflect the actual number of positions affected by this legislation. In the event that positions have been, or will be, created as a result of other legislation, please provide details in the Notes section below the table.
|
Position Title and Department |
Position # for Existing Positions |
Fund Name & # |
PT/FT |
2008 Positions |
2008 FTE |
2009 Positions* |
2009 FTE* |
|
|
|
|
|
|
|
|
|
|
|
|
|
|
|
|
|
|
|
|
|
|
|
|
|
|
|
|
TOTAL |
|
|
|
|
|
|
|
* 2009 positions and FTE are total 2009 position changes resulting from this legislation, not incremental changes. Therefore, under 2009, please be sure to include any continuing positions from 2008.
Notes: None.
· Do positions sunset in the future? (If yes, identify sunset date):
Spending/Cash Flow: This table should be completed only in those cases where part or all of the funds authorized by this legislation will be spent in a different year than when they were appropriated (e.g., as in the case of certain grants and capital projects). Details surrounding spending that will occur in future years should be provided in the Notes section below the table.
|
Fund Name & # |
Department |
Budget Control Level* |
2008 Expenditures |
2009 Anticipated Expenditures |
|
|
|
|
|
|
|
TOTAL |
|
|
|
|
* See budget book to obtain the appropriate Budget Control Level for your department.
Notes: None.
· What is the financial cost of not implementing the legislation? (Estimate the costs to the City of not implementing the legislation, including estimated costs to maintain or expand an existing facility or the cost avoidance due to replacement of an existing facility, potential conflicts with regulatory requirements, or other potential costs if the legislation is not implemented.)
The cost of not implementing this legislation would mean foregoing a below market new renewable resource that not only meets the requirements of SCL’s 2008 integrated resource plan but also reduces the risk of SCL not meeting its renewable portfolio standard targets. Not only is this resource low cost, it is considered a highly dependable renewable resource because it generates greater than 85% of the time thus providing high assurance of meeting load. SCL has no other renewable resource in its portfolio that can claim an 85% capacity factor.
· What are the possible alternatives to the legislation that could achieve the same or similar objectives? (Include any potential alternatives to the proposed legislation, such as reducing fee-supported activities, identifying outside funding sources for fee-supported activities, etc.)
None.
· Is the legislation subject to public hearing requirements: (If yes, what public hearings have been held to date, and/or what plans are in place to hold a public hearing(s) in the future.)
No. A public hearing is not required but, in addition to the public notice and comment period, there will be an opportunity for public comment at the Council meeting where this legislation is considered.
· Other Issues (including long-term implications of the legislation):
None.
Please list attachments to the fiscal note below:
Attachment A - City Light Issue Paper, Columbia Ridge Renewable Power Purchase
Attachment B - Economic Analysis Summary
Exhibit 1 to Attachment B - Economic Analysis Spreadsheet
Attachment A
|
Columbia Ridge Renewable Power Purchase |
|||||
|
|
|
|
|
||
|
Date: |
January 30, 2009 |
|
|
||
|
Previous Brief Dated: |
None |
|
|
||
|
|
|
|
|
||
|
Key Contacts |
Marilynn Semro |
Phone # 6-4539 |
|
||
|
|
Steven Dadashi |
Phone # 6-4512 |
|
||
|
|
|
|
|
||
|
Council Action Required? |
Y |
If YES, within the next 3 months? |
Y |
||
|
Summary Statement |
Under this 20-year renewable power purchase agreement Seattle City Light (‘SCL’) receives electrical output and environmental attributes from the new Columbia Ridge landfill electric generating facility (‘Columbia Ridge’ or ‘Facility’), owned by WM Renewable Energy, LLC (‘WM’) and located in the City of Arlington, Gilliam County, Oregon. Columbia Ridge can produce 6.4 MW of electrical output and SCL will purchase the energy in excess of station service and the preparation of the landfill gas or about 5.8 average MW (‘aMW’) annually. SCL will receive all of the environmental attributes associated with the 6.4 MW of electrical output. This Facility is expected to have a capacity factor in excess of 95%. The Facility is currently in the design stages. Test power is expected in September 2009 with an on-line date expected in October 2009. There is a positive net present value to SCL in excess of $11 million associated with the acquisition of this resource. Columbia Ridge is an eligible renewable resource under Washington State’s Energy Independence Act (Chapter 19.285 RCW) and complies with Washington State’s greenhouse gas emissions rules for base load generation (Chapter 80.80 RCW).
|
Background |
WM intends to build, own and operate a 6.4 MW electric generating facility at the Columbia Ridge landfill site. As part of Seattle Public Utilities’ 2008 agreement with Waste Management of Washington, WM is offering to sell SCL new renewable energy from Columbia Ridge.
SCL’s 2008 Integrated Resource Plans calls for the purchase of 6 aMW of new base load renewable resource starting in 2010. The Columbia Ridge resource acquisition meets that requirement. In addition, this resource will help SCL meet the requirements of Washington State’s Energy Independence Act (Chapter 19.285 RCW) also known as I-937.
Additional features of this agreement include:
- This contract is conditional upon WM receiving a Generator Interconnection Agreement with Columbia Basin Electric Cooperative and an Integration Agreement with the Bonneville Power Administration that is reasonably acceptable to them as to form, substance and cost. (Section 2.3.2 and 2.3.3 of Power Purchase Agreement (‘PPA’)).
- This agreement is the culmination of a joint effort between SCL and Seattle Public Utilities (‘SPU’) and is tied to their agreement with Waste Management of Washington. This PPA terminates on March 31, 2028. However, WM has the right to terminate this agreement with SCL if SPU terminates their April 7, 2008 agreement with Waste Management of Washington, Inc. (‘WMW’). Notice of termination by SPU to WMW must be 6 months prior to March 31, 2019 and notice to SCL must be within 30 days after receipt of notice by WMW from SPU. If SPU does not exercise their option to terminate in 2019, the next opportunity by SPU to terminate will be March 31, 2021. (Section 2.5.2.2 PPA).
- If WM decides to expand the generation at the Facility, this contract provides an exclusive window for SCL to negotiate the purchase of the additional output. (Section 3.6 of PPA).
- WM guarantees an output of 44,500 MWh per year less any force majeure events. This is, in effect, guaranteeing an 88% capacity factor. Delivery of less than 44,500 MWh as adjusted will require WM to pay SCL for replacement power and renewable energy certificates that meet I-937 requirements. (Article 6 of PPA).
- Enhanced operating procedures reflecting expanded North American Electric Reliability Corporation and the Western Electric Coordinating Council requirements are provided in a separate exhibit for ease of use by operating personnel. (Exhibit H of PPA).
- The output of the Facility will be dynamically scheduled to SCL’s balancing authority. (Exhibit H of PPA).
|
Key Issues |
Risk and Risk Mitigation.
1. If WM cannot negotiate a Generator Interconnection Agreement (‘GIA’) with the local utility that is reasonably acceptable to them in cost, form and substance, they may not proceed with building the resource. Currently (January 2009) the potential larger issues are the technical requirements being proposed by the Bonneville Power Administration’s (‘BPA’) and associated costs. The interconnection is to a BPA 115 kV line. WM has formally asked BPA for an exception from some of these requirements. As this issue is on-going, any mitigation by SCL will be dependent on the action of other parties.
2. If the Integration Agreement (IA) between WM and BPA is not reasonably acceptable to WM as to form, substance and cost, WM may not proceed with building the resource. The IA is subject to the same technical requirements as the GIA and has similar issues. As this issue is on-going, any mitigation by SCL will be dependent on the action of other parties.
3. SPU termination of their agreement with Waste Management of Washington. It is possible that the early termination of this agreement would leave SCL short of resources for meeting resource adequacy targets as well as meeting I-937 requirements. SCL, at a minimum, must contact SPU in early 2018 and in early 2020 as necessary to determine the risk of SPU terminating their agreement with WMW. If this appears possible, SCL must take appropriate action to mitigate any potential impacts.
4. SCL transmission redirect request to BPA. In September 2008 SCL initiated a request on BPA’s OASIS for transmission service for Columbia Ridge. Despite an error with the OASIS computer program and another error with BPA’s algorithm calculating transmission impacts that have caused delays, SCL expects approval of this request about April or May 2009.
Economics.
This resource has a net present value to SCL in excess of $11 million. Documentation and spreadsheet are included as Attachment B.
Alternatives.
At the moment there are no comparable alternatives to this resource. It is a low cost, renewable, high capacity factor, base load resource with firm transmission to Seattle that meets our resource adequacy requirements, Washington State’s Energy Independence Act, and the State’s greenhouse gas emissions requirements.
|
Next Steps |
Keep abreast of any GIA, IA or other issues with the construction of the resource and determine if SCL can assist.
Seek legislative approval.
Attachment B
COLUMBIA RIDGE POWER PURCHASE
ECONOMIC ANALYSIS SUMMARY
1. Energy. The annual amount of energy delivered to SCL at the delivery point is expected to be 5.76 aMW (about 50,414 MWh/year) except in year 1 and year 20 of the contract.
The energy delivery amount is calculated assuming the following:
a. plant capacity is 6.4 MW,
b. maintenance and forced outages are 0.32 aMW,
c. station use and energy used in preparation of the landfill gas is 0.30 aMW, and
d. interconnection losses, including transformer step-up losses are 0.025 aMW.
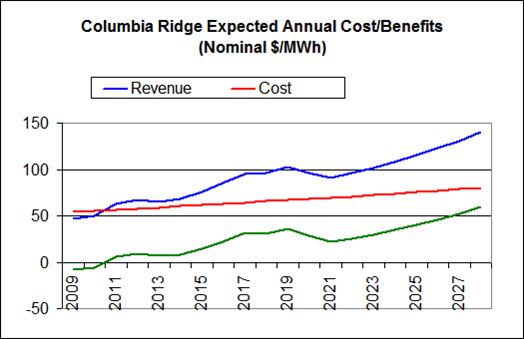
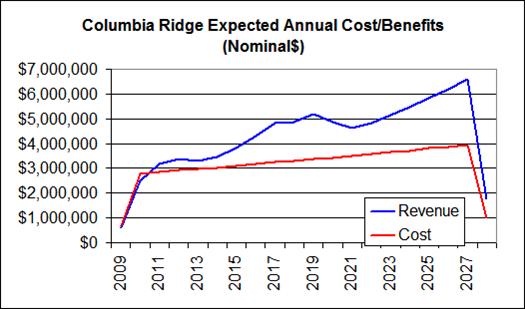
2. Benefits. The revenue potential to SCL resulting from this power purchase is the market value of the energy plus REC value.
The benefits analysis assumed the following:
a. Northwest market energy price using Ventyx February 2009 Short-Term Forecast for the period October 2009 through February 2011 and Ventyx Fall 2008 WECC Reference Case Forecast (2008$) for the period March 2011 through March 31, 2028; plus
b. REC value starting at $5.50/MWh escalating at 5% per year with a cap of $50/MWh.
Table 1 shows the annual revenue potential from the power purchase.
Table 1
Annual Revenue from Columbia Ridge (2008$)
|
|
Net MWh |
Market Value |
REC Value |
Total Revenue |
$/MWh |
|
2009* |
12,707 |
$504,664 |
$72,035 |
$576,699 |
45.38 |
|
2010 |
50,414 |
$2,094,757 |
$292,932 |
$2,387,689 |
47.36 |
|
2011 |
50,414 |
$2,650,896 |
$300,120 |
$2,951,016 |
58.54 |
|
2012 |
50,414 |
$2,776,628 |
$307,679 |
$3,084,307 |
61.18 |
|
2013 |
50,552 |
$2,617,749 |
$316,382 |
$2,934,131 |
58.04 |
|
2014 |
50,414 |
$2,665,558 |
$323,141 |
$2,988,699 |
59.28 |
|
2015 |
50,414 |
$2,908,482 |
$331,818 |
$3,240,300 |
64.27 |
|
2016 |
50,414 |
$3,203,425 |
$340,876 |
$3,544,301 |
70.30 |
|
2017 |
50,552 |
$3,561,185 |
$351,200 |
$3,912,385 |
77.39 |
|
2018 |
50,414 |
$3,482,948 |
$359,879 |
$3,842,827 |
76.23 |
|
2019 |
50,414 |
$3,649,568 |
$369,796 |
$4,019,364 |
79.73 |
|
2020 |
50,414 |
$3,316,816 |
$379,986 |
$3,696,802 |
73.33 |
|
2021 |
50,552 |
$3,035,971 |
$391,527 |
$3,427,498 |
67.80 |
|
2022 |
50,414 |
$3,103,210 |
$401,218 |
$3,504,428 |
69.51 |
|
2023 |
50,414 |
$3,236,595 |
$412,274 |
$3,648,869 |
72.38 |
|
2024 |
50,414 |
$3,375,775 |
$423,635 |
$3,799,410 |
75.36 |
|
2025 |
50,552 |
$3,530,651 |
$436,502 |
$3,967,153 |
78.48 |
|
2026 |
50,414 |
$3,672,549 |
$447,305 |
$4,119,854 |
81.72 |
|
2027 |
50,414 |
$3,830,686 |
$459,561 |
$4,290,247 |
85.10 |
|
2028^ |
12,569 |
$1,008,568 |
$117,769 |
$1,126,337 |
89.61 |
|
Total/NPV |
933,277 |
$42,361,812 |
$4,961,719 |
$47,323,532 |
$50.71 |
*Starting Date October 1, 2009
^Ending Date March 31, 2028
3. Cost: There are 4 costs to be considered: (a) purchase cost, (b) the opportunity cost of firm transmission on BPA’s system redirected from LaGrande to the Facility, (c) loss return, and (d) reserves.
The cost analysis assumed the following:
a. contract purchase price of $51.50/MWh escalating each January 1 at 2%, plus
b. the opportunity cost of SCL’s inability to use the firm transmission that was redirected from LaGrande to the Facility at $1.25/MWh (real 2008$) escalated at an inflation rate of 2.28%, plus
c. return of losses to BPA at 1.9%/MWh * Northwest market price using Ventyx Fall 2008 Reference Case Forecast (real 2008$), plus
d. reserves of 6% per MWh in accordance with revised WECC requirements in effect in the Spring of 2009 at a rate of $7.36 (real 2008$) reflecting SCL’s OATT schedule for reserves.
Table 2 shows the annual cost of the power purchase.
Table 2
Annual Cost of Columbia Ridge (2008$)
|
|
Net MWh |
Purchase Cost |
Transmission Opportunity |
Transmission Losses |
Reserves |
Total Cost |
$ per MWh |
||
|
2009* |
12,707 |
$641,225 |
$16,156 |
$9,997 |
$5,706 |
$673,084 |
$52.97 |
||
|
2010 |
50,414 |
$2,533,069 |
$63,992 |
$41,495 |
$22,100 |
$2,660,656 |
$52.78 |
||
|
2011 |
50,414 |
$2,521,953 |
$63,859 |
$52,511 |
$21,564 |
$2,659,009 |
$52.74 |
||
|
2012 |
50,414 |
$2,515,631 |
$63,766 |
$55,002 |
$21,054 |
$2,650,550 |
$52.58 |
||
|
2013 |
50,552 |
$2,517,426 |
$63,866 |
$51,855 |
$20,619 |
$2,644,315 |
$52.31 |
||
|
2014 |
50,414 |
$2,504,526 |
$63,535 |
$52,802 |
$20,056 |
$2,624,763 |
$52.06 |
||
|
2015 |
50,414 |
$2,497,660 |
$63,546 |
$57,614 |
$19,614 |
$2,622,957 |
$52.03 |
||
|
2016 |
50,414 |
$2,492,051 |
$63,584 |
$63,456 |
$19,190 |
$2,623,320 |
$52.04 |
||
|
2017 |
50,552 |
$2,490,516 |
$63,807 |
$70,543 |
$18,830 |
$2,632,375 |
$52.07 |
||
|
2018 |
50,414 |
$2,478,610 |
$63,685 |
$68,993 |
$18,376 |
$2,618,927 |
$51.95 |
||
|
2019 |
50,414 |
$2,470,940 |
$63,740 |
$72,294 |
$17,984 |
$2,617,443 |
$51.92 |
||
|
2020 |
50,414 |
$2,464,558 |
$63,794 |
$65,702 |
$17,599 |
$2,606,084 |
$51.69 |
||
|
2021 |
50,552 |
$2,466,135 |
$64,024 |
$60,139 |
$17,270 |
$2,602,715 |
$51.49 |
||
|
2022 |
50,414 |
$2,451,934 |
$63,903 |
$61,471 |
$16,855 |
$2,592,365 |
$51.42 |
||
|
2023 |
50,414 |
$2,445,741 |
$63,958 |
$64,113 |
$16,495 |
$2,590,287 |
$51.38 |
||
|
2024 |
50,414 |
$2,439,107 |
$64,013 |
$66,870 |
$16,142 |
$2,588,340 |
$51.34 |
||
|
2025 |
50,552 |
$2,438,755 |
$64,243 |
$69,938 |
$15,840 |
$2,593,614 |
$51.31 |
||
|
2026 |
50,414 |
$2,426,161 |
$64,122 |
$72,749 |
$15,459 |
$2,584,856 |
$51.27 |
||
|
2027 |
50,414 |
$2,421,416 |
$64,167 |
$75,882 |
$15,127 |
$2,582,944 |
$51.23 |
||
|
2028^ |
12,569 |
$602,794 |
$15,750 |
$19,979 |
$3,692 |
$643,796 |
$51.22 |
||
|
NPV @ 3% |
$34,023,313 |
$876,978 |
$839,139 |
$256,817 |
$35,996,248 |
$38.57 |
|||
*Starting Date October 1, 2009
^Ending Date March 31, 2028
4. The net benefit of the power purchase is the market value of the power plus the market value of the RECs net of the cost.
Table 3 shows annual value of the gross and net benefits to SCL.
Table 3
Net Benefit of the Columbia Ridge Purchase (2008$)
|
|
Revenue |
Cost |
Net Benefits |
|
2009* |
$576,699 |
$673,084 |
-$96,385 |
|
2010 |
$2,387,689 |
$2,660,656 |
-$272,967 |
|
2011 |
$2,951,016 |
$2,659,009 |
$292,007 |
|
2012 |
$3,084,307 |
$2,650,550 |
$433,757 |
|
2013 |
$2,934,131 |
$2,644,315 |
$289,816 |
|
2014 |
$2,988,699 |
$2,624,763 |
$363,936 |
|
2015 |
$3,240,300 |
$2,622,957 |
$617,343 |
|
2016 |
$3,544,301 |
$2,623,320 |
$920,981 |
|
2017 |
$3,912,385 |
$2,632,375 |
$1,280,010 |
|
2018 |
$3,842,827 |
$2,618,927 |
$1,223,900 |
|
2019 |
$4,019,364 |
$2,617,443 |
$1,401,920 |
|
2020 |
$3,696,802 |
$2,606,084 |
$1,090,718 |
|
2021 |
$3,427,498 |
$2,602,715 |
$824,783 |
|
2022 |
$3,504,428 |
$2,592,365 |
$912,063 |
|
2023 |
$3,648,869 |
$2,590,287 |
$1,058,582 |
|
2024 |
$3,799,410 |
$2,588,340 |
$1,211,070 |
|
2025 |
$3,967,153 |
$2,593,614 |
$1,373,538 |
|
2026 |
$4,119,854 |
$2,584,856 |
$1,534,997 |
|
2027 |
$4,290,247 |
$2,582,944 |
$1,707,303 |
|
2028^ |
$1,126,337 |
$643,796 |
$482,541 |
|
Total/NPV |
$47,323,532 |
$35,996,248 |
$11,327,284 |
|
NPV ($/MWh) |
$50.71 |
$38.57 |
$12.14 |
*Starting Date October 1, 2009
^Ending Date March 31, 2028
The present value of the net gain is about $11.3 M at a 3% discount rate with an estimated average benefit of $12.41/MWh over the 20-year period.