Demographic Trends
The characteristics of the U.S. population have changed
tremendously since the 1950s. The
population is aging, households have become smaller and more diverse, and birth
rates have dropped. The Seattle
metropolitan area has not been immune to these changes.
Since 1960, married couples with children have declined by
almost 50 percent, from 65,100 to 33,700 households in 1990 (see Figure
2-7). At the same time, the number of
single-parent families with children, single-person households and households
with unrelated persons living together have all increased. Households composed of single parents with
children have increased by almost 100 percent from 7,600 in 1960 to 14,000 in
2000. Single-person households, which
were not counted separately until 1980, have increased by 26 percent from
83,800 in 1980 to 105,500 in 2000.
Households with unrelated persons living together have increased by 80
percent from 21,600 in 1980 to 39,600 in 2000.
Seattle’s average household size has declined from 2.70
persons in 1960 to 2.08 in 2000. This
decline in average household size is again a national and regional phenomenon,
and is not unique to Seattle. The decrease in household size means that a
greater number of housing units are needed to house the city’s population,
compared to what the need would be for a population with a larger average
household size.
These trends of increasing diversity of household types and
smaller households are expected to continue over the next twenty years, for the
nation, and for Seattle and King County.
Table 2-5
Seattle Households by Household Type and Size, 1960-2020
|
|
1960*
|
1970*
|
1980
|
1990
|
2000
|
2010
|
2020
|
|
Family
|
|
Married couple no
child
|
59,040
|
63,310
|
56,073
|
53,070
|
50,931
|
56,783
|
64,782
|
|
Married couple with
child
|
65,106
|
49,140
|
32,430
|
31,776
|
33,717
|
36,846
|
37,566
|
|
Parent with child
& no spouse
|
7,648
|
10,916
|
15,063
|
15,853
|
16,366
|
14,798
|
14,934
|
|
Other family no
child
|
10,722
|
9,934
|
10,557
|
12,270
|
12,386
|
15,398
|
17,538
|
|
Non-Family
|
|
One person living
alone
|
|
|
83,799
|
94,179
|
105,542
|
113,239
|
127,369
|
|
Two or more persons
no child
|
|
|
20,558
|
28,672
|
38,857
|
38,928
|
41,124
|
|
Two or more persons
with child
|
|
|
1,078
|
882
|
700
|
218
|
227
|
|
Total
|
200,577
|
206,092
|
219,469
|
236,702
|
258,499
|
276,211
|
303,540
|
|
|
|
Persons per Household
|
|
Average household
size
|
2.70
|
2.48
|
2.14
|
2.09
|
2.08
|
2.08
|
2.05
|
|
Change since last
decade
|
|
-8.2%
|
-13.7%
|
-2.3%
|
-0.5%
|
-0%
|
-1.3%
|
*Refers to own child of the head of the household rather
than any child in the household.
Sources: U.S. Census
Bureau, decennial censuses, 1960 to 2000; 2010 and 2020: forecast by City of
Seattle Department of Planning & Development, July 2004, based on data from
U.S. Census Bureau, decennial censuses, 1990 and 2000; Washington State Office
of Financial Management King County Age Forecasts; and Puget Sound Regional
Council 2010 and 2020 population projections for Seattle.
Table 2-6
Percent of Seattle Households by Type, 1960-2020
|
|
1960*
|
1970*
|
1980
|
1990
|
2000
|
2010
|
2020
|
|
Family
|
|
Married couple no
child
|
29%
|
31%
|
26%
|
22%
|
20%
|
21%
|
21%
|
|
Married couple with
child
|
33%
|
24%
|
15%
|
13%
|
13%
|
13%
|
12%
|
|
Parent with child
& no spouse
|
4%
|
5%
|
7%
|
7%
|
6%
|
5%
|
5%
|
|
Other family no
child
|
5%
|
5%
|
5%
|
5%
|
5%
|
6%
|
6%
|
|
Non-Family
|
|
One person living
alone
|
|
|
38%
|
40%
|
41%
|
41%
|
42%
|
|
Two or more persons
no child
|
|
|
9%
|
12%
|
15%
|
14%
|
14%
|
|
Two or more persons
with child
|
|
|
0%
|
1%
|
1%
|
1%
|
0%
|
|
Total
|
100%
|
100%
|
100%
|
100%
|
100%
|
100%
|
100%
|
*Refers to own child of the head of the household rather
than any child in the household.
Sources: U.S. Census Bureau, decennial censuses, 1960 to
2000; 2010 and 2020: forecast by City of Seattle Department of Planning &
Development, July 2004, based on data from U.S. Census Bureau, decennial
censuses, 1990 and 2000; Washington State Office of Financial Management King
County Age Forecasts; and Puget Sound Regional Council 2010 and 2020 population
projections for Seattle.
Figure
2-7
Seattle Households with Children,
1960-2020
* Percents for 1960 and 1970 do not include any households
where a child lived with non-relatives.
Sources: U.S. Census Bureau,
decennial censuses 1960-2000; 2010 and 2020 forecast by City of Seattle
Department of Planning & Development, July 2004.
Table 2-8
Seattle Population by Age, 1960-2020
|
Age
|
1960*
|
1970*
|
1980
|
1990
|
2000
|
2010
|
2020
|
|
0
to 4
|
51,946
|
34,994
|
24,235
|
29,269
|
26,215
|
27,971
|
30,706
|
|
5
to 14
|
99,850
|
83,903
|
50,707
|
43,899
|
47,884
|
45,065
|
48,917
|
|
15
to 24
|
66,712
|
95,813
|
89,268
|
74,005
|
80,662
|
91,117
|
87,394
|
|
25
to 34
|
66,277
|
67,315
|
106,595
|
112,098
|
122,282
|
113,155
|
131,782
|
|
35
to 44
|
76,922
|
50,655
|
49,028
|
93,285
|
95,077
|
84,585
|
79,968
|
|
45
to 64
|
128,583
|
128,499
|
97,839
|
85,303
|
123,447
|
156,925
|
155,499
|
|
65
to 84
|
63,146
|
63,554
|
68,120
|
69,129
|
56,736
|
60,387
|
92,291
|
|
85
& +
|
3,651
|
6,098
|
8,054
|
9,271
|
11,071
|
14,910
|
15,233
|
|
Total
|
557,087
|
530,831
|
493,846
|
516,259
|
563,374
|
596,125
|
643,810
|
*
Numbers for 1960 and 1970 do not include any households where a child lived
with non-relatives.
Source:
U.S. Census Bureau, decennial censuses, 1960-2000
Figure 2-9
Seattle Population by Age, Percent Change 2000-2020
|
Age
|
2000-2010
Change
|
2000-2020
Change
|
|
(number)
|
(percent)
|
(number)
|
(percent)
|
|
0
to 4
|
1,756
|
6.7%
|
4,491
|
17.1%
|
|
5
to 14
|
-2,819
|
-5.9%
|
1,033
|
2.2%
|
|
15
to 24
|
10,455
|
13.0%
|
6,732
|
8.3%
|
|
25
to 34
|
-9,127
|
-7.5%
|
9,500
|
7.8%
|
|
35
to 44
|
-10,492
|
-11.0%
|
-15,109
|
-15.9%
|
|
45
to 64
|
33,478
|
27.1%
|
32,555
|
26.0%
|
|
65
to 84
|
3,651
|
6.4%
|
35,555
|
62.7%
|
|
85
& +
|
3,839
|
34.7%
|
4,162
|
37.6%
|
|
Total
|
30,751
|
5.4%
|
78,416
|
13.9%
|
Sources: 2000 Census; 2010 and 2020 forecast by City of
Seattle Department of Planning & Development, July 2004, based on data from
U.S. Census Bureau, decennial censuses, 1990 and 2000; Washington State Office
of Financial Management King County Age Forecasts; and Puget Sound Regional
Council 2010 and 2020 population projections for Seattle.
Housing Tenure
Just under one-half of the housing units in Seattle were
owner-occupied at the time of the 2000 Census: 48.4% owner-occupied and 51.6%
renter-occupied. Rental units tend to
have fewer bedrooms than owned housing.
Over 60% of rental units in Seattle were one-bedroom or studios. Only 12% had three or more bedrooms. Owned units, on the other hand, are larger,
with over 60% having at least three bedrooms.
Table 2-10
Housing Tenure by Size of Unit, 2000
|
Number
of Bedrooms
|
Renter-Occupied
|
Owner-Occupied
|
Total Units
|
|
0
and 1 bedroom
|
81,422
|
11,502
|
92,924
|
|
2
bedrooms
|
36,258
|
36,229
|
72,487
|
|
3
or more bedrooms
|
15,679
|
77,420
|
93,099
|
|
|
|
|
|
|
Total
|
133,359
|
125,151
|
258,510
|
Homeownership rates vary widely by neighborhood. Rates are
highest overall in West Seattle: over 50% in all neighborhoods in that sector
of Seattle and over 60% in the Admiral District and Morgan Junction. Rates are
also high in most parts of North Seattle and in North Rainier Valley.
Homeownership rates are lowest in Downtown and surrounding City Center
neighborhoods, which are quite urban in character. The University District
homeownership rate is 7%, which is extremely low. Homeownership rates are also
notably lower than average in Fremont (14%), Rainier Beach (26%), the Central
Area (37%), and North Beacon Hill (38%). The table on the following page shows
the homeownership rates for each of the neighborhood planning areas in Seattle.
Homeownership Rate by
Neighborhood Planning Area, 2000
|
Neighborhood Planning Area
|
Homeownership Rate
|
|
CITYWIDE
|
48%
|
|
Admiral
|
63%
|
|
Aurora-Licton
Springs
|
43%
|
|
Ballard-Crown
Hill
|
55%
|
|
Belltown
|
22%
|
|
Ballard-Interbay-Northend
Manufacturing/Industrial Center
|
34%
|
|
Broadway-Bitter
Lake-Haller Lake
|
53%
|
|
Capitol
Hill
|
16%
|
|
Central
Area
|
37%
|
|
Chinatown-International
District
|
2%
|
|
Columbia
City
|
34%
|
|
Commercial
Core
|
23%
|
|
Delridge
|
51%
|
|
Denny
Triangle
|
1%
|
|
Eastlake
|
24%
|
|
First
Hill
|
14%
|
|
Fremont
|
29%
|
|
Georgetown
|
34%
|
|
Greater
Duwamish
|
48%
|
|
Greenlake
|
53%
|
|
Greenwood-Phinney
Ridge
|
55%
|
|
Lake
City
|
58%
|
|
MLK
at Holly
|
40%
|
|
Morgan
Junction
|
61%
|
|
North
Beacon Hill
|
38%
|
|
North
Rainier
|
59%
|
|
Northgate
|
50%
|
|
Pike-Pine
|
8%
|
|
Pioneer
Square
|
8%
|
|
Queen
Anne
|
9%
|
|
Rainier
Beach
|
26%
|
|
Roosevelt
|
49%
|
|
South
Lake Union
|
0%
|
|
South
Park
|
45%
|
|
University
District
|
7%
|
|
Wallingford
|
46%
|
|
West
Seattle
|
57%
|
|
Westwood-Highland
Park
|
54%
|
Source:
2000 Census
Homeownership rates also vary by race/ethnicity, as
illustrated by the table below. White households have a higher-than-average
homeownership rate, at 51%. According to the 2000 Census, the homeownership
rate was 46% among Asian/Pacific Islander households, 36% among African
American households, and only 25% among Hispanic or Latino households. Due in
large part to the influx of Hispanic/Latino households in the past decade, the
homeownership rate for that population has dropped considerably, from 32% in
1990 to 25% in 2000.
Table 2-12
Homeownership
Rate by Race, 2000
Source: 2000 Census
Rental Housing Market
Average rents in 2004 for rental apartments in Seattle are
$889 per unit in larger buildings and $845 per unit for single-family houses,
duplex and triplex units, and smaller apartment buildings.
Table 2-13
Average Actual Rent for 20+ Unit Apartment Buildings, 2004
|
Neighborhood
|
Rent
|
|
Belltown
|
$1,197
|
|
Central
|
$987
|
|
Queen
Anne
|
$936
|
|
Greenlake/Wallingford
|
$926
|
|
Madison/Leschi
|
$905
|
|
Magnolia
|
$899
|
|
Capitol
Hill/Eastlake
|
$816
|
|
University
|
$814
|
|
First
Hill
|
$791
|
|
West
Seattle
|
$761
|
|
North
Seattle
|
$757
|
|
Beacon
Hill
|
$749
|
|
Ballard
|
$713
|
|
Rainier
Valley
|
$647
|
|
CITYWIDE
|
$889
|
Source:
Dupre +Scott, Apartment Vacancy Report, April 2004
Table 2-14
Average Actual Rent for 1-19 Unit Apartment Buildings, 2004
Neighborhood
|
Rent
|
|
Madison/Leschi
|
$1,103
|
|
Queen
Anne
|
$934
|
|
First
Hill
|
$886
|
|
Central
|
$884
|
|
West
Seattle
|
$854
|
|
Capitol
Hill/Eastlake
|
$849
|
|
University
|
$836
|
|
Magnolia
|
$832
|
|
Greenlake/Wallingford
|
$831
|
|
Beacon
Hill
|
$823
|
|
North
Seattle
|
$810
|
|
Rainier
Valley
|
$793
|
|
Ballard
|
$781
|
|
CITYWIDE
|
$845
|
Source:
Dupre +Scott, 1-19 Unit Apartment Report, May 2004
As of 2004, average citywide vacancy rates were in the 6-7%
range, which is higher than the commonly recognized balance point for the
rental market of 5%. The average citywide vacancy rate has not yet fully
returned to its pre-economic recession level.
Table 2-15
Average Market Vacancy for 20+ Unit Apartment Buildings, 2004
|
Neighborhood
|
Vacancy
|
|
Greenlake/Wallingford
|
3.3%
|
|
Rainier
Valley
|
4.3%
|
|
Ballard
|
4.6%
|
|
Capitol
Hill/Eastlake
|
4.6%
|
|
University
|
4.7%
|
|
Queen
Anne
|
5.2%
|
|
Madison/Leschi
|
5.8%
|
|
West
Seattle
|
6.8%
|
|
Central
|
7.0%
|
|
North
Seattle
|
7.0%
|
|
Magnolia
|
7.5%
|
|
Belltown
|
7.8%
|
|
First
Hill
|
8.1%
|
|
Beacon
Hill
|
10.7%
|
|
CITYWIDE
|
6.4%
|
Source:
Dupre +Scott, Apartment Vacancy Report, April 2004
Table 2-16
Average Market Vacancy for 1-19 Unit Apartment Buildings, 2004
|
Neighborhood
|
Vacancy
|
|
Ballard
|
3.2%
|
|
First
Hill
|
3.6%
|
|
University
|
4.8%
|
|
Central
|
4.9%
|
|
Capitol
Hill/Eastlake
|
5.4%
|
|
Madison/Leschi
|
5.4%
|
|
Magnolia
|
5.6%
|
|
Queen
Anne
|
5.6%
|
|
Greenlake/Wallingford
|
6.0%
|
|
Beacon
Hill
|
8.3%
|
|
West
Seattle
|
8.6%
|
|
Rainier
Valley
|
9.9%
|
|
North
Seattle
|
10.7%
|
|
CITYWIDE
|
6.6%
|
Source:
Dupre +Scott, 1-19 Unit Apartment Report, May 2004
The rental market softened significantly during the
recession of recent years, and rents have not yet quite recovered to levels of
a couple years ago. Seattle’s vacancy rate peaked in 2002 at 7.4% and is on its
way down again. A couple of indicators signal a modest recovery in the rental
market: (1) rent incentives are slightly down from one year ago; (2) apartments
are leasing up slightly faster; and (3) the turnover rate for apartments
dropped slightly. However, less than one-quarter of apartment managers surveyed
by Dupre + Scott in 2004 plan to increase rents over the next six months, and
those increases are expected to be modest.
The following tables detail what has happened with rents and
vacancies the past six years. The recession sent rents in most neighborhoods
downward in 2001 and 2002. The rental market in some neighborhoods has yet to
recover. Beacon Hill and Madison/Leschi were particularly hit hard, with 2004
rents 13% and 11% lower respectively than they were several years ago. However,
Ballard, Queen Anne, and the University District saw rents continue to climb
throughout the recession. Rents in the Central Area, First Hill, and Rainier
Valley peaked in 2003, but dropped 3-5% in the past year.
Table 2-17
Average Actual Rents in 20+ Unit Buildings, 1999-2004
|
Area
|
Apr-99
|
Apr-00
|
Apr-01
|
Apr-02
|
Apr-03
|
Apr-04
|
|
Ballard
|
$572
|
$639
|
$687
|
$706
|
$704
|
$713
|
|
Beacon
Hill
|
$650
|
$712
|
$865
|
$767
|
$708
|
$749
|
|
Belltown
|
$1,013
|
$1,087
|
$1,229
|
$1,208
|
$1,206
|
$1,197
|
|
Capitol
Hill/Eastlake
|
$742
|
$779
|
$819
|
$825
|
$807
|
$816
|
|
Central
|
$835
|
$914
|
$958
|
$986
|
$1,041
|
$987
|
|
First
Hill
|
$684
|
$751
|
$759
|
$783
|
$813
|
$791
|
|
Greenlake/Wallingford
|
$824
|
$907
|
$886
|
$939
|
$893
|
$926
|
|
Madison/Leschi
|
$925
|
$960
|
$983
|
$1,012
|
$952
|
$905
|
|
Magnolia
|
$794
|
$871
|
$883
|
$951
|
$914
|
$899
|
|
North
Seattle
|
$714
|
$738
|
$763
|
$787
|
$776
|
$757
|
|
Queen
Anne
|
$858
|
$885
|
$884
|
$923
|
$923
|
$936
|
|
Rainier
Valley
|
$534
|
$592
|
$613
|
$627
|
$673
|
$647
|
|
University
|
$699
|
$786
|
$775
|
$806
|
$805
|
$814
|
|
West
Seattle
|
$745
|
$750
|
$783
|
$808
|
$773
|
$761
|
|
CITYWIDE
|
$780
|
$820
|
$860
|
$892
|
$887
|
$889
|
Source: Dupre + Scott, Apartment Vacancy Reports, 1999-2004
Vacancy rates peaked in most Seattle neighborhoods in 2002
and 2003. They have declined to below 8% in all neighborhoods except Beacon
Hill and First Hill, where the vacancy rate is 10.7% and 8.1% respectively. The
market is generally considered in balance when vacancy rates are about 5%.
Prior to the recession, the Seattle market exhibited a severe shortage of
rental housing, with a citywide vacancy rate of only 2.1%. Many Seattle
neighborhoods had vacancy rates in the 0-2% range, which the industry considers
to be effectively a no-vacancy situation that puts significant inflationary
pressures on rents. Vacancy rates in two of Seattle’s most affordable
neighborhoods, Rainier Valley and Ballard, never even reached 5% during the
recession.
Table 2-18
Average Market Vacancy in 20+ Unit Buildings, 1999-2004
|
Area
|
Apr-99
|
Apr-00
|
Apr-01
|
Apr-02
|
Apr-03
|
Apr-04
|
|
Ballard
|
0.3%
|
0.8%
|
1.0%
|
4.8%
|
4.8%
|
4.6%
|
|
Beacon
Hill
|
3.2%
|
2.4%
|
5.1%
|
5.2%
|
6.7%
|
10.7%
|
|
Belltown
|
3.1%
|
2.5%
|
6.4%
|
11.4%
|
8.2%
|
7.8%
|
|
Capitol
Hill/Eastlake
|
1.6%
|
1.5%
|
2.4%
|
6.4%
|
6.1%
|
4.6%
|
|
Central
|
1.9%
|
2.1%
|
4.6%
|
6.9%
|
9.7%
|
7.0%
|
|
First
Hill
|
3.1%
|
2.5%
|
4.3%
|
8.8%
|
8.3%
|
8.1%
|
|
Greenlake/Wallingford
|
2.5%
|
1.3%
|
1.4%
|
3.5%
|
4.0%
|
3.3%
|
|
Madison/Leschi
|
0.7%
|
1.6%
|
2.1%
|
3.8%
|
3.4%
|
5.8%
|
|
Magnolia
|
2.8%
|
1.9%
|
4.2%
|
7.6%
|
7.0%
|
7.5%
|
|
North
Seattle
|
2.3%
|
2.3%
|
2.7%
|
7.2%
|
6.5%
|
7.0%
|
|
Queen
Anne
|
2.3%
|
2.1%
|
2.8%
|
5.9%
|
6.7%
|
5.2%
|
|
Rainier
Valley
|
2.7%
|
1.9%
|
1.3%
|
3.8%
|
3.7%
|
4.3%
|
|
University
|
3.7%
|
1.8%
|
1.3%
|
5.5%
|
6.4%
|
4.7%
|
|
West
Seattle
|
2.8%
|
3.4%
|
4.1%
|
8.1%
|
8.2%
|
6.8%
|
|
CITYWIDE
|
2.5%
|
2.1%
|
3.3%
|
7.4%
|
6.9%
|
6.4%
|
Source: Dupre + Scott, Apartment Vacancy Reports, 1999-2004
Average rents for single-family homes, duplexes and other
multifamily buildings with less than 20 residential units generally run
slightly higher than rents in larger apartment complexes. However, this sector
of the rental market has not fully recovered. The average citywide rent was
$845 in 2004, which is still 6% lower than the 2002 figure. Unlike the 20+ unit
buildings, the recession seemed to generally have an equally negative impact on
rents for single-family houses and smaller complexes in most Seattle
neighborhoods.
Table 2-19
Average Actual Rents for 1-19 Unit Buildings, 2002-2004
|
Area
|
May-02
|
May-03
|
May-04
|
|
Ballard
|
$809
|
$797
|
$781
|
|
Beacon
Hill
|
$824
|
$809
|
$823
|
|
Capitol
Hill/Eastlake
|
$875
|
$856
|
$849
|
|
Central
|
$1,006
|
$900
|
$884
|
|
First
Hill
|
$896
|
$883
|
$886
|
|
Greenlake/Wallingford
|
$903
|
$891
|
$831
|
|
Madison/Leschi
|
$998
|
$1,153
|
$1,103
|
|
Magnolia
|
$954
|
$909
|
$832
|
|
North
Seattle
|
$859
|
$844
|
$810
|
|
Queen
Anne
|
$980
|
$987
|
$934
|
|
Rainier
Valley
|
$836
|
$854
|
$793
|
|
University
|
$891
|
$926
|
$836
|
|
West
Seattle
|
$891
|
$889
|
$854
|
|
CITYWIDE
|
$897
|
$884
|
$845
|
Source:
Dupre + Scott, 1-19 Unit Apartment Reports, 2002-2004
Vacancy rates for this particular sector of the rental
market vary widely by neighborhood. The range in 2004 was a low of 3.2% in
Ballard to a high of 10.7% in North Seattle. The citywide average vacancy rate
for single-family houses and small complexes is 6.6%, just slightly higher than
the citywide vacancy rate for 20+ unit residential buildings.
Table 2-20
Average Market Vacancy for 1-19 Unit Buildings, 2002-2004
|
Area
|
May-02
|
May-03
|
May-04
|
|
Ballard
|
3.5%
|
4.0%
|
3.2%
|
|
Beacon
Hill
|
4.3%
|
5.2%
|
8.3%
|
|
Capitol
Hill/Eastlake
|
4.6%
|
4.1%
|
5.4%
|
|
Central
|
5.3%
|
5.4%
|
4.9%
|
|
First
Hill
|
0.0%
|
3.4%
|
3.6%
|
|
Greenlake/Wallingford
|
5.6%
|
6.5%
|
6.0%
|
|
Madison/Leschi
|
4.5%
|
5.1%
|
5.4%
|
|
Magnolia
|
5.8%
|
5.2%
|
5.6%
|
|
North
Seattle
|
4.8%
|
9.0%
|
10.7%
|
|
Queen
Anne
|
5.3%
|
8.2%
|
5.6%
|
|
Rainier
Valley
|
6.0%
|
7.4%
|
9.9%
|
|
University
|
5.6%
|
8.0%
|
4.8%
|
|
West
Seattle
|
4.7%
|
6.3%
|
8.6%
|
|
CITYWIDE
|
5.0%
|
6.5%
|
6.6%
|
Source:
Dupre + Scott, 1-19 Unit Apartment Reports, 2002-2004
Wages and Cost of Housing
According to HUD, housing is “affordable” when housing costs
do not exceed 30% of a household’s combined income. The average rent for a one-bedroom apartment in Seattle in 2003
was $843. In order for an individual to
afford that rent they would need to have an annual income of $33,720 ($16.20
per hour). The average rent for a
two-bedroom, one-bathroom apartment in Seattle in 2003 was $954, which requires
a household income of $38,160 ($18.35 an hour). The table below shows what rents would be affordable for people
in typical lower-wage occupations, based on median wages in the Seattle area
for those occupations.
Table 2-21
Affordable Rents for Lower-Wage Occupations
|
Occupation
|
Median
Wage (2002)
|
Affordable
Rent
|
|
Fast
food cook
|
$8.10
|
$420
|
|
Child
care worker
|
$8.40
|
$435
|
|
Retail
sales person
|
$10.30
|
$535
|
|
Nursing
aide
|
$10.50
|
$545
|
|
Custodian
|
$10.65
|
$555
|
|
Administrative
assistant
|
$16.20
|
$840
|
|
Elementary
school teacher
|
$16.40*
|
$855
|
|
Retail
sales manager
|
$17.00
|
$885
|
|
Family
therapist
|
$17.60
|
$915
|
|
Social
worker
|
$20.00
|
$1,040
|
|
Computer
support specialist
|
$22.50
|
$1,170
|
* Starting wage for
an elementary school teacher
Source: Washington
Department of Employment Security,
Wage Database, 2002
Home Sale Prices
In 2003, the average and median sale price for single-family
homes in Seattle were $363,000 and $310,000 respectively. Prices range widely
by sector and neighborhood. Median sale prices ranged from $420,000 to over
$1,000,000 in Central and West neighborhoods, with the exception of the
“Central Area”, where the median sale price was under $300,000. Houses are
generally most affordable in Southwest and Southeast Seattle neighborhoods. The
only neighborhoods in the city with median sale prices under $200,000 are
located in those two sectors.
High housing costs in the for-sale market are keeping
homeownership out of reach for many Seattle families.
Seattle’s median home price of $310,000 presents an affordability gap even for
households with incomes at 100% of median income. According to a 2003 King
County report, a median income household can afford a $260,000 home and
first-time homebuyers can afford a $197,000 home. Note that not since 1970 has
a household at 100% of median income been able to easily afford a median-priced
home in Seattle or greater King County. In addition, although there continues
to be an affordability gap for median-income and first-time homebuyers, that
gap has actually decreased significantly in the past few years, due primarily
to falling interest rates.
Table 2-22
Single-Family Home Sale Prices for Selected Neighborhoods, 2003
|
Neighborhood
|
Average
|
Median
|
Number
of Sales
|
|
CITYWIDE
|
$363,000
|
$310,000
|
7,879
|
|
Southwest
Seattle
|
|
Admiral
|
$326,000
|
$330,000
|
93
|
|
Delridge
|
$207,000
|
$194,000
|
30
|
|
Fauntleroy
|
$412,000
|
$373,000
|
82
|
|
Gatewood
|
$326,000
|
$300,000
|
116
|
|
Highland
Park
|
$217,000
|
$211,000
|
126
|
|
South
Park
|
$178,000
|
$178,000
|
29
|
|
Westwood
|
$220,000
|
$219,000
|
97
|
|
West
Seattle
|
$294,000
|
$255,000
|
431
|
|
Southeast
Seattle
|
|
Columbia
City
|
$260,000
|
$244,000
|
77
|
|
Hillman
City
|
$217,000
|
$216,000
|
24
|
|
Mount
Baker
|
$443,000
|
$358,000
|
123
|
|
Rainier
Beach
|
$255,000
|
$222,000
|
37
|
|
Rainier
Valley
|
$190,000
|
$188,000
|
24
|
|
Seward
Park
|
$384,000
|
$325,000
|
130
|
|
Beacon
Hill
|
$248,000
|
$240,000
|
284
|
|
Georgetown
|
$212,000
|
$197,000
|
10
|
(Table continued on following page.)
Table 2-22
(Continued)
Single-Family Home Sale Prices for Selected Neighborhoods, 2003
|
Neighborhood
|
Average
|
Median
|
Number
of Sales
|
|
Central
|
|
Capitol
Hill
|
$576,000
|
$469,000
|
173
|
|
Central
Area
|
$276,000
|
$281,000
|
116
|
|
Leschi
|
$496,000
|
$410,000
|
100
|
|
Madison
Park
|
$834,000
|
$675,000
|
39
|
|
Madrona
|
$534,000
|
$490,000
|
95
|
|
Montlake
|
$531,000
|
$515,000
|
70
|
|
Washington
Park
|
$1,358,250
|
$1,035,000
|
25
|
West
|
|
Magnolia
|
$497,000
|
$419,000
|
374
|
|
Queen
Anne
|
$527,000
|
$445,000
|
355
|
Northwest
|
|
Ballard
|
$316,000
|
$303,000
|
344
|
|
Broadview
|
$357,000
|
$305,000
|
165
|
|
Crown
Hill
|
$292,000
|
$282,000
|
93
|
|
Fremont
|
$363,000
|
$339,000
|
117
|
|
Green
Lake
|
$345,000
|
$325,000
|
408
|
|
Greenwood
|
$268,000
|
$263,000
|
167
|
|
Haller
Lake
|
$260,000
|
$247,000
|
88
|
|
Loyal
Heights
|
$324,000
|
$316,000
|
125
|
|
North
Beach
|
$519,000
|
$490,000
|
64
|
|
Phinney
Ridge
|
$385,000
|
$356,000
|
160
|
|
Sunset
Hill
|
$416,000
|
$390,000
|
71
|
|
Wallingford
|
$400,000
|
$383,000
|
202
|
Northeast
|
|
Bryant
|
$384,000
|
$370,000
|
148
|
|
Hawthorne
Hills
|
$459,000
|
$410,000
|
54
|
|
Lake
City
|
$274,000
|
$258,000
|
48
|
|
Laurelhurst
|
$709,000
|
$565,000
|
95
|
|
Maple
Leaf
|
$319,000
|
$301,000
|
184
|
|
Meadowbrook
|
$315,000
|
$300,000
|
91
|
|
Northgate
|
$281,000
|
$270,000
|
23
|
|
Ravenna
|
$378,000
|
$359,000
|
176
|
|
View
Ridge
|
$462,000
|
$397,000
|
70
|
Source: NW Multiple
Listings Service, January 2004
Condominiums constituted one-quarter of all home sales in
2003. The average and median sale prices for condominiums in Seattle were
$257,000 and $220,000 respectively in 2003. Unlike the single-family market,
median sale prices for condominiums do not vary significantly by neighborhood.
Condominiums are least affordable in Downtown and some of Seattle’s waterfront
neighborhoods, like Alki and Leschi. Condominiums are most affordable in North
Seattle. The following table details condominium sale prices by neighborhood.
Table 2-23
Condominium Sale Prices for Selected Neighborhoods, 2003
|
Neighborhood
|
Average
|
Median
|
Number
of Sales
|
|
CITYWIDE
|
$257,000
|
$220,000
|
2,707
|
|
Southwest
|
|
|
|
|
Admiral
|
$226,000
|
$203,000
|
26
|
|
Alki
|
$380,000
|
$355,000
|
59
|
|
West Seattle
|
$218,000
|
$206,000
|
180
|
|
Westwood
|
$199,000
|
$208,000
|
41
|
|
Downtown
|
|
|
|
|
Belltown
|
$311,000
|
$262,000
|
257
|
|
Downtown
|
$491,000
|
$365,000
|
66
|
|
Pioneer Square
|
$381,000
|
$302,000
|
5
|
|
Central
|
|
|
|
|
Capitol Hill
|
$228,000
|
$205,000
|
369
|
|
Central Area
|
$199,000
|
$180,000
|
21
|
|
Leschi
|
$373,000
|
$310,000
|
14
|
|
Madison Park
|
$347,000
|
$274,000
|
38
|
|
West
|
|
|
|
|
Magnolia
|
$230,000
|
$190,000
|
86
|
|
Queen Anne
|
$268,000
|
$230,000
|
429
|
|
Northwest
|
|
|
|
|
Ballard
|
$211,000
|
$205,000
|
74
|
|
Fremont
|
$290,000
|
$257,000
|
82
|
|
Green Lake
|
$243,000
|
$245,000
|
50
|
|
Greenwood
|
$179,000
|
$170,000
|
57
|
|
Phinney Ridge
|
$253,000
|
$248,000
|
40
|
|
Wallingford
|
$243,000
|
$217,000
|
86
|
|
Northeast
|
|
|
|
|
Jackson Park
|
$185,000
|
$186,000
|
22
|
|
Lake City
|
$138,000
|
$143,000
|
14
|
|
Laurelhurst
|
$191,000
|
$174,000
|
24
|
|
Maple Leaf
|
$143,000
|
$141,000
|
15
|
|
Northgate
|
$143,000
|
$134,000
|
48
|
|
Ravenna
|
$227,000
|
$210,000
|
24
|
|
Sand Point
|
$183,000
|
$156,000
|
32
|
|
University District
|
$216,000
|
$208,000
|
44
|
Source: NW Multiple
Listings Service, January 2004
Residential Development Trends
Seattle’s urban village strategy, which is outlined in the
City’s Comprehensive Plan, seeks to achieve several goals: (1) accommodate the
City’s share of expected regional growth; (2) revitalize existing neighborhood
business districts; (3) minimize impacts on most single-family neighborhoods;
(4) make efficient use of past and future City infrastructure investments; and
(5) promote higher levels of pedestrian and transit travel. Seattle’s five
urban centers (Downtown, First Hill/Capitol Hill, Uptown, University, and
Northgate) together will take the lion’s share of Seattle’s expected growth.
Concentrations of both commercial activity and multifamily housing are planned
for urban villages, at lower densities than will be found in the urban centers.
Seattle’s population grew 6% during the 1990s to exceed its
previous historical peak. New Seattle residents are contributing to new housing
construction, most of which is being built in the City’s urban centers and
villages. Seattle’s housing supply grew by approximately 21,500 units between
January 1995 and 2003. Over eight years, 45% of the twenty-year growth targeted
for Seattle has been built (including units for which building permits had been
issued as of 12/31/03).
Certain urban centers and villages are struggling to meet
their 1994-2014 residential growth targets. These include the Northgate urban
center, where only 171 units have been built since 1994, which is 6% of the
3,000 unit target. Pioneer Square in Downtown is also far behind in meeting its
residential growth target of 2,100 units, with only 51 built and 94 permitted
as of 12/31/03 (7% of target). In North Seattle, the Bitter Lake hub urban
village and Crown Hill and Roosevelt residential urban villages have met less
than 20% of their growth targets. Three of the five urban villages in Southeast
Seattle are also at less than 20% of their targets.
The table on the following page shows progress toward
meeting residential growth targets for each of the urban centers and villages
in Seattle.
Table 2-24
Net Housing Unit Growth in Urban Centers and Villages
|
|
Net Units Built 1995-2003
|
Units Permitted but not Built as of 1/1/04
|
20-Year Growth Target (1994-2014)
|
% of Growth Target Achieved
|
|
URBAN CENTERS
|
9,203
|
1,558
|
26,662
|
40%
|
|
1st Hill/Capitol Hill
|
2,233
|
281
|
5,540
|
45%
|
|
12th
Avenue
|
837
|
7
|
540
|
156%
|
|
Capitol
Hill
|
431
|
143
|
1,980
|
29%
|
|
First
Hill
|
420
|
132
|
2,400
|
23%
|
|
Pike/Pine
|
545
|
-1
|
620
|
88%
|
|
Downtown Urban Center
|
5,103
|
1,040
|
14,700
|
42%
|
|
Belltown
|
3,227
|
403
|
6,500
|
56%
|
|
Chinatown-International
District
|
456
|
191
|
1,300
|
50%
|
|
Commercial
Core
|
1,076
|
-4
|
1,300
|
82%
|
|
Denny
Triangle
|
293
|
356
|
3,500
|
19%
|
|
Pioneer
Square
|
51
|
94
|
2,100
|
7%
|
|
Northgate
|
171
|
0
|
3,000
|
6%
|
|
University
|
826
|
122
|
2,110
|
45%
|
|
Ravenna
|
285
|
0
|
480
|
59%
|
|
University
District Northwest
|
564
|
122
|
1,630
|
42%
|
|
Uptown
|
870
|
115
|
1,312
|
75%
|
|
HUB URBAN VILLAGES
|
2,463
|
1,659
|
9,000
|
46%
|
|
Ballard
|
459
|
637
|
1,520
|
72%
|
|
Bitter
Lake Village
|
208
|
4
|
1,260
|
17%
|
|
Fremont
|
176
|
152
|
820
|
40%
|
|
Lake
City
|
549
|
95
|
1,400
|
46%
|
|
North
Rainier
|
129
|
220
|
1,200
|
29%
|
|
South
Lake Union
|
440
|
382
|
1,700
|
48%
|
|
West
Seattle Junction
|
502
|
169
|
1,100
|
61%
|
(Table continued on
following page.)
Table 2-24
(Continued)
Net Housing Unit Growth in Urban Centers and Villages
|
|
Net Units Built 1995-2003
|
Units Permitted but not Built as of 1/1/04
|
20-Year Growth Target (1994-2014)
|
% of Growth Target Achieved
|
|
RESIDENTIAL URBAN VILLAGES
|
3,964
|
1,129
|
9,000
|
57%
|
|
23rd
& Union-Jackson
|
579
|
258
|
900
|
93%
|
|
Admiral
|
214
|
0
|
340
|
63%
|
|
Aurora-Licton
Springs
|
382
|
54
|
900
|
48%
|
|
Columbia
City
|
75
|
54
|
740
|
17%
|
|
Crown
Hill
|
48
|
1
|
310
|
16%
|
|
Eastlake
|
333
|
168
|
380
|
132%
|
|
Green
Lake
|
110
|
118
|
400
|
57%
|
|
Greenwood-Phinney
Ridge
|
358
|
51
|
350
|
117%
|
|
Madison-Miller
|
395
|
299
|
400
|
174%
|
|
MLK
at Holly St
|
512
|
39
|
800
|
69%
|
|
Morgan
Junction
|
52
|
4
|
300
|
19%
|
|
North
Beacon Hill
|
71
|
18
|
550
|
16%
|
|
Queen
Anne
|
85
|
1
|
300
|
29%
|
|
Rainier
Beach
|
80
|
9
|
740
|
12%
|
|
Roosevelt
|
62
|
1
|
340
|
19%
|
|
South
Park
|
85
|
12
|
350
|
28%
|
|
Wallingford
|
409
|
17
|
200
|
213%
|
|
Westwood-Highland
Park
|
114
|
25
|
700
|
20%
|
|
AREAS OUTSIDE OF VILLAGES
|
5,827
|
967
|
15,300
|
44%
|
|
Total Inside Centers/Villages
|
15,630
|
4,346
|
44,662
|
45%
|
|
TOTAL SEATTLE GROWTH
|
21,457
|
5,313
|
59,962
|
45%
|
Source: Department of Planning & Development, January
2004
Residential development trends in Seattle over the last
forty years have generally followed cyclical expansions and contractions in
employment growth in the region.
Significant increases in housing occurred in the early 1990s and between
1999 and 2002. These housing booms were
followed by slowdowns in housing construction starting in 1992 and 2003.
 Source: Seattle Department of
Planning & Development, 2004
Source: Seattle Department of
Planning & Development, 2004
Since the adoption of the Comprehensive Plan in 1994,
Seattle has averaged a net addition of 2,300 residential units a year,
according to City permit records.
Development activity was strongest between 1999 and 2002, with a peak of
3,800 net new units completed in 2001.
This strong housing growth fell off in 2003 as a result of a weak
economy and a related slow-down of immigration into the state and city. In January of 2000, there were active
permits for an additional 7,000 units including units under construction. In April of 2004, that number had dropped to
4,500.
Most new housing development in Seattle is in multifamily
development in Multifamily, Commercial and Downtown zones. Thirteen percent of units built in Seattle
since 1994 have been built in single-family zones, an average of 300 units a
year. Just over one-third of housing
development has occurred in multifamily zones, 28% in commercial areas outside
of Downtown, and 23% in Downtown since 1994.
The Comprehensive Plan estimates a net increase of 47,000
households in Seattle between 2004 and 2024.
The city will need to average 2,450 new housing units a year to meet
this target. Average annual production
will need to be slightly higher in coming years than it has been in the past
five.
 As of 2004, Seattle has an estimated
residential development capacity for 116,000 new housing units, or
two-and-a-half times the amount of housing estimated to locate in Seattle over
the next twenty years (see Table 2-26 and Figure 2-27 below). At the time the capacity figure was
calculated, Seattle had 268,000 housing units, so the total housing stock would
be 384,000 housing units if all this capacity were used.
As of 2004, Seattle has an estimated
residential development capacity for 116,000 new housing units, or
two-and-a-half times the amount of housing estimated to locate in Seattle over
the next twenty years (see Table 2-26 and Figure 2-27 below). At the time the capacity figure was
calculated, Seattle had 268,000 housing units, so the total housing stock would
be 384,000 housing units if all this capacity were used.
 Residential development capacity includes
vacant land in residential zones, underutilized sites in residential zones, and
some of the vacant and underutilized sites in commercial zones. Underutilized sites are sites where the
existing developed density is low compared to the allowed developed density, or
where the value of the improvements on the site is low compared to the value of
the land.
Residential development capacity includes
vacant land in residential zones, underutilized sites in residential zones, and
some of the vacant and underutilized sites in commercial zones. Underutilized sites are sites where the
existing developed density is low compared to the allowed developed density, or
where the value of the improvements on the site is low compared to the value of
the land.
Assisted
Rental Housing Inventory
The estimated inventory of assisted rental housing in
Seattle is approximately 25,000 units. Of these, 20,277 are rental units with
publicly-funded capital subsidies, and the other 4,723 is an estimate of the
number of tenant-based Section 8 vouchers being used to lease otherwise
unsubsidized residential units in Seattle.
Subsidized Rental Housing with Capital Subsidies
As of May 2004, the Office of Housing’s (OH) Subsidized
Rental Housing Database showed that there were 20,277 affordable rental units
with capital subsidies in Seattle. As of the end of 2003, 7,793 of these units
were in 238 City-funded projects. The remaining units have capital subsidies
through federal, state, or county programs but are not City-funded. The
following table summarizes affordability of Seattle’s subsidized rental housing
stock:
Table 2-28
Rental Housing Units with Capital Subsidies, by Affordability
|
Affordability
|
Number of Units
|
|
0-30%
of MI
|
|
|
31-50%
of MI
|
|
|
51-80%
of MI
|
|
|
TOTAL
|
|
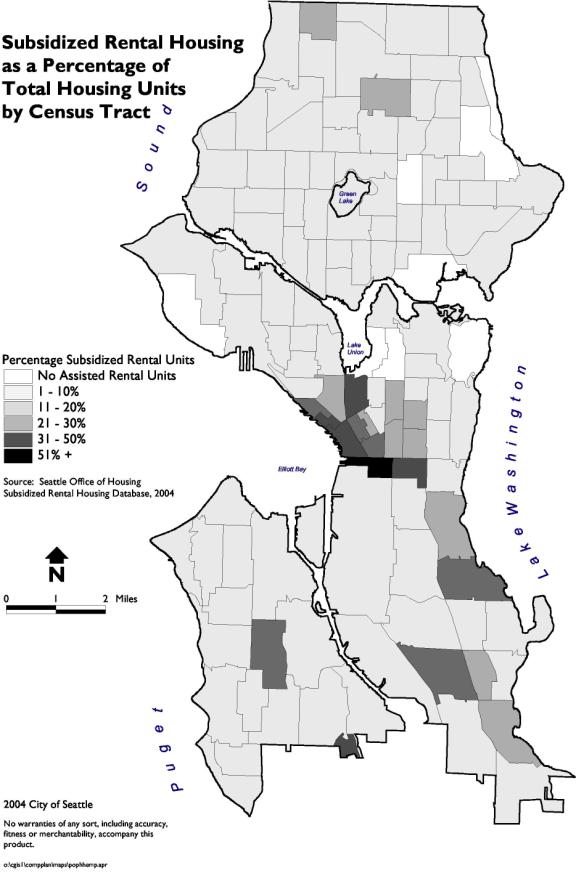
The map on the following page illustrates the concentration
of subsidized rental housing as a percentage of total housing units. Most of
this valuable housing stock is dispersed throughout the City, with the majority
of Census Tracts having a subsidized rental housing concentration of less than
10% of total housing units.
Subsidized rental housing is concentrated in Downtown, which
ensures residents easy access to jobs, public transportation, retail, hospitals
and health clinics, and social services. Downtown’s Pioneer Square and
International District neighborhoods have much higher concentrations of
subsidized housing for extremely low-income populations than anywhere else in
Seattle. The percentage of total housing units that serve households with
incomes 0-30% of income is 60% in Pioneer Square and 48% in the International
District. The Downtown Commercial Core and South Lake Union have the next
highest concentrations of subsidized rental housing for extremely low-income
people, with about one-quarter of the total housing units serving households
0-30% of MI.
About 13% of total housing units are subsidized rentals in
North Seattle’s Bitter Lake and Northgate neighborhoods. Between 20-25% of
total housing units are subsidized rentals in the High Point neighborhood in
West Seattle, Holly Park neighborhood in south Beacon Hill, and Columbia City
in Rainier Valley. Three other census tracts in the Rainier Valley, including
Census Tract 118 in Rainier Beach, have concentrations of subsidized rental
housing of ranging between 12-19% of total housing units.
City-Funded Affordable Rental Housing
Over the past two decades, the City of Seattle has provided
funding for affordable housing serving low-income families, seniors, low-wage
working people, and people with disabilities, including HIV/AIDS. Over time,
the City-funded portfolio of below-market-rent apartments has grown to 7,793
housing units in 238 development projects. This housing includes a range of
apartment sizes in small and large developments dispersed throughout the city.
Figure 2-30
Source:
Office of Housing, 2003 Report of Accomplishments
This affordable housing is a significant asset for Seattle.
Nearly half of the housing units are reserved for extremely low-income
households with incomes up to 30 percent of the region’s median household
income ($16,350 for an individual or $21,050 for a family of three in 2004).
These housing units are often combined with supportive services to assist
residents to live independently or transition out of homelessness. Much of the
balance of OH’s housing portfolio is workforce housing serving individuals and
families with incomes up to 50 or 60 percent of the median income (up to
$32,700 for an individual or $42,050 for a family of three). For lower-income
residents, paying an affordable rent frees up resources for other important
needs such as food, medical expenses, clothing, transportation, and education.
Figure 2-31
Source:
Office of Housing, 2003 Report of Accomplishments
The City plays a monitoring and oversight role to ensure
that units remain affordable and continue to serve intended residents as time
goes by, and that City-funded buildings themselves remain in good physical
condition and are financially viable.
City-Funded Service-Enriched Housing
Service-enriched housing (also known as “supportive
housing”) is a successful housing model for stabilizing and moving vulnerable
people along a path to self-sufficiency. Affordable housing linked to
accessible healthcare, mental health, employment, childcare and other services
offers the support that these individuals and families need to succeed.
Service-enriched housing gives homeless people a way out of expensive emergency
public services and into their own homes and communities; it both improves the
lives of its residents and can generate significant public savings.
For the City of Seattle, service-enriched housing has long
been a priority. Of the 7,793 City-funded affordable rental units, 34% (2,984)
serve homeless and special needs residents. This housing is in stand-alone
projects or units set aside within larger, general population apartment
buildings. Most of the special needs housing, 2,445 units, serves families and
individuals who are also homeless; 630 are transitional units and 1,815 provide
a permanent residence.
Figure 2-32
Source: Office of Housing, 2003 Report of Accomplishments
The City provides operating support to projects that serve
homeless and special needs residents. Due to the extremely low incomes of the
tenants, rents are insufficient to cover building operations costs. OH provides
annual operating subsidies to 530 units using 1986, 1995 and 2002 Housing Levy
funding. In addition, project-based Section 8 rental assistance provided
through the Seattle Housing Authority supports 970 City-funded units.
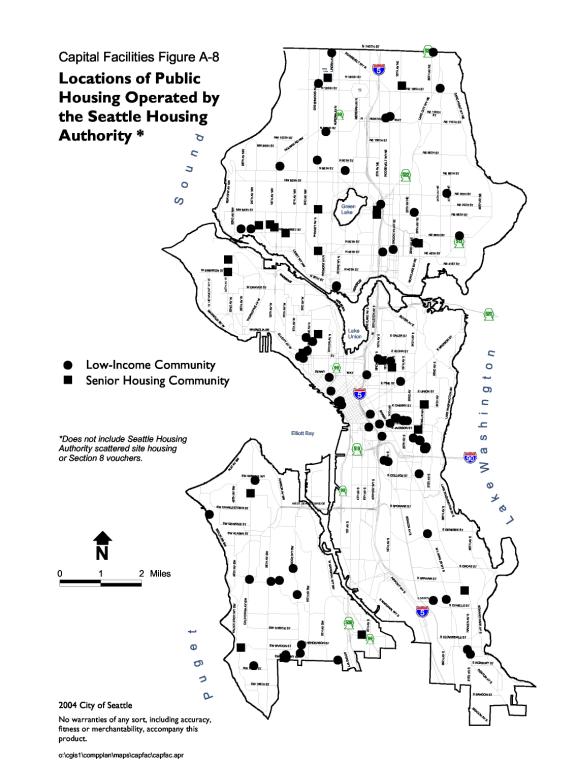
Seattle Housing Authority Inventory
As of 12/31/03, the inventory of affordable rental housing
owned or managed by the Seattle Housing Authority (SHA) totaled 7,433 units.
Thirty-four percent of SHA’s units (2,513) are 2-bedrooms or larger and serve
families. Over 90% of SHA’s 7,433 units serve extremely low-income households
(0-30% of MI). Almost 70% of SHA’s inventory is public housing: 4,990 total
units, including 770 scattered site units. Over 20% of the units (1,088) are
provided through the Seattle Senior Housing Program (SSHP). The remaining 18% are
units funded through other local and federal programs, including federal HOPE
VI, Section 8, Section 811, or Section 202, and 1986 Seattle Housing Levy. The
map on the following page illustrates the location of residential buildings
owned or managed by SHA (with the exception of scattered site public housing).
Figure 2-33
Source:
Seattle Housing Authority, Spring 2004
Source: Seattle Housing Authority,
12/31/03
|
|
Tenant-Based Rental Assistance
Tenant-based rental assistance is a category of subsidy that
is provided to tenants rather than to a project. Section 8 Housing Choice
Vouchers are the primary form of tenant-based assistance. Housing Choice
Vouchers allow participating tenants to choose and rent units from private
owners. SHA pays a fixed amount of the rent to the owner of the apartment or
home each month, and the tenant pays the difference between that subsidy and
the total rent, in addition to any utilities not included in the rent.
As of May 2004, 5,339 vouchers were used being used by
individuals and families to lease apartments in Seattle. This number excludes
vouchers used in SHA projects financed under certain programs (i.e. Seattle
Senior Housing Program, federal Moderate Rehabilitation Program), which are
part of the 20,277 rental units with capital subsidies described above. It also
excludes vouchers that have been project-based or are being used outside of
Seattle. It does include vouchers provided by other housing authorities that
are being used to lease units in Seattle.
As noted previously, Seattle’s total inventory of assisted
rental housing inventory is approximately 25,000 units, an estimated 4,723 of
which are otherwise unsubsidized units leased using tenant-based Section 8
vouchers. The Office of Housing compared addresses for projects in its
Subsidized Rental Housing Database with addresses of buildings where Section 8
vouchers are used in order to avoid double-counting affordable housing units
that have both tenant-based and project-based subsidies. The comparison
confirmed that at least 570 of the 5,339 vouchers are being used to lease units
in buildings with project-based subsidies. The estimate of voucher use in
Seattle was reduced to 4,723 for the purpose of estimating Seattle’s total
inventory of assisted rental housing (25,000 units).
About 40% of Section 8 vouchers are used to lease
residential units located in the Central Area south of Yesler and Southeast
Seattle. The following table shows the breakdown of Section 8 voucher use by
sector for Seattle.
|
West
(includes Downtown)
|
642
|
12%
|
|
East
(includes Central Area north of Yesler)
|
610
|
11%
|
|
Southeast
(includes Central Area south of Yesler)
|
2,069
|
39%
|
|
Southwest
|
807
|
15%
|
|
Northwest
|
640
|
12%
|
|
Northeast
|
571
|
11%
|
|
Total
|
5,339
|
100%
|
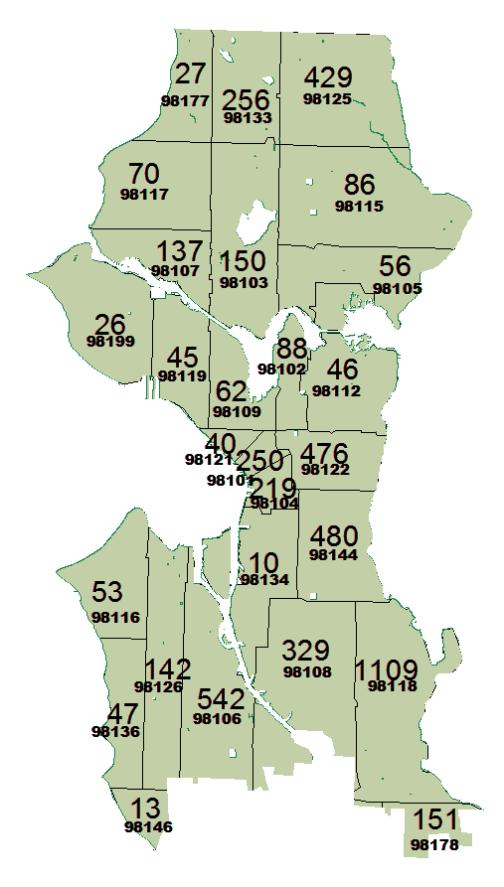
The map on the following page identifies the number of
vouchers being used to lease housing units, by zip code, as of April 2004.
Twenty percent of Seattle’s Section 8 vouchers are used to lease housing
located in the 98118 zip code in the Rainier Valley.