Attachment 10
LAND USE APPENDICES
Table of Contents
LAND USE APPENDIX A
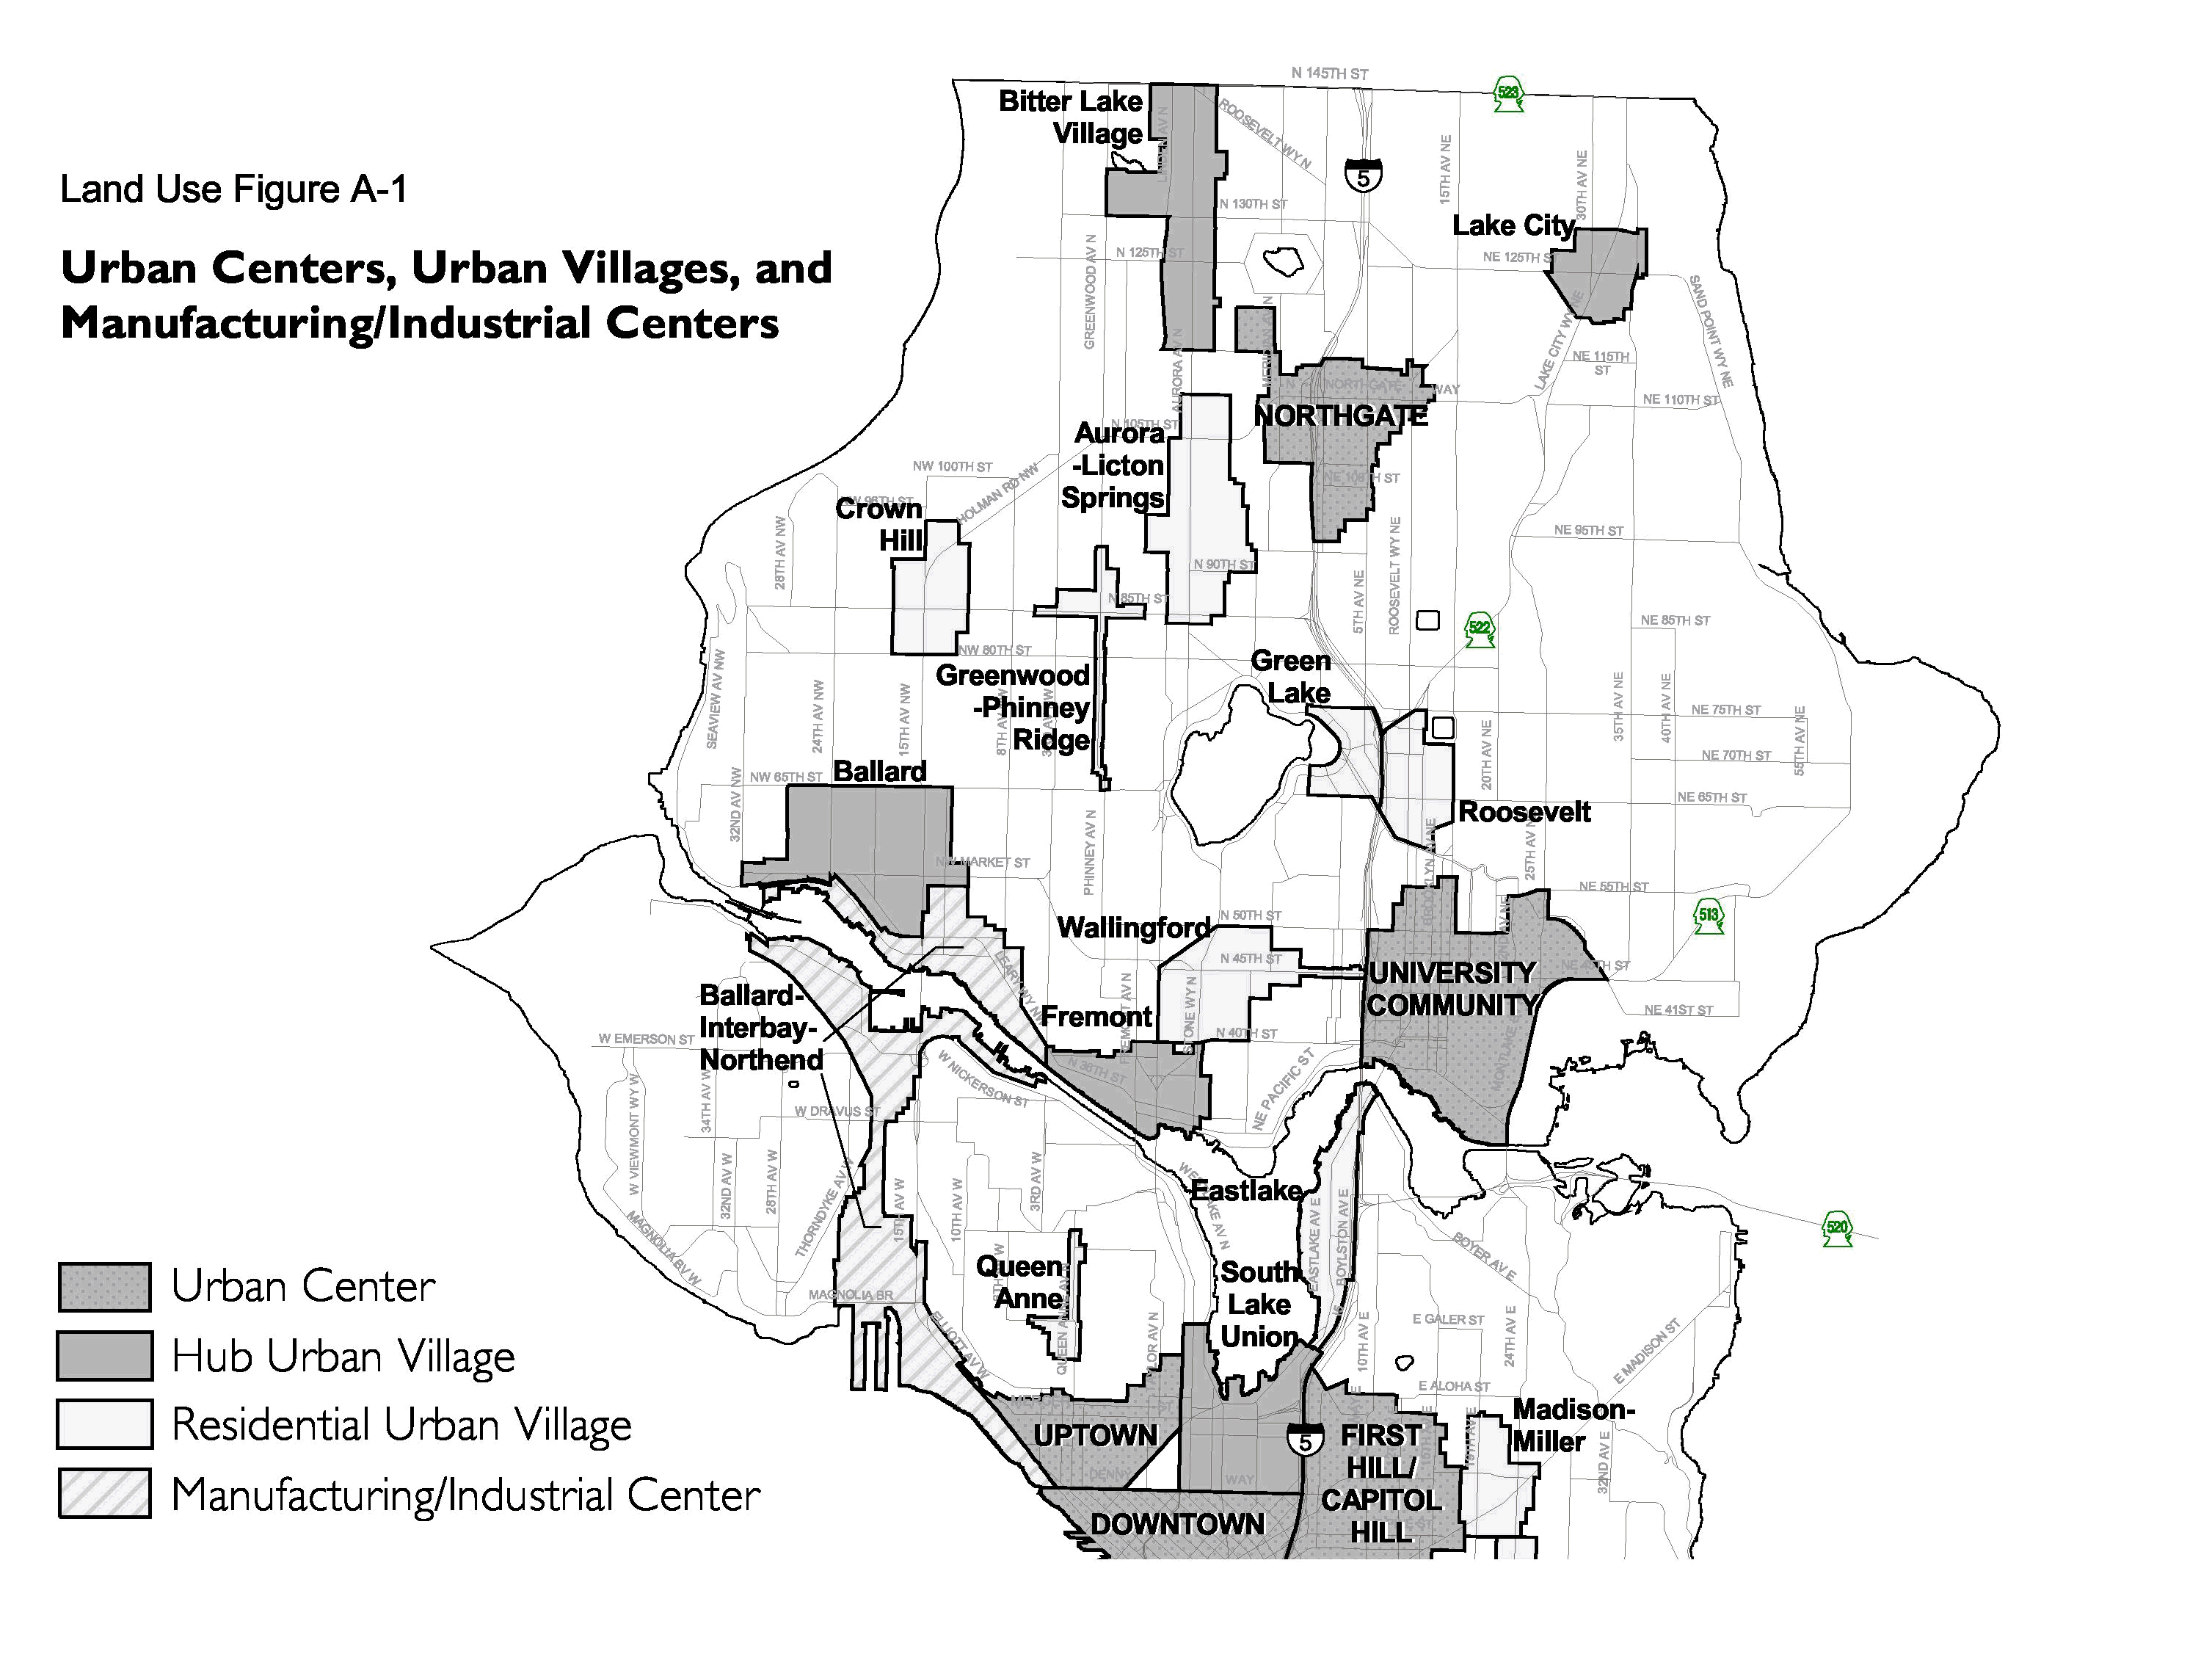
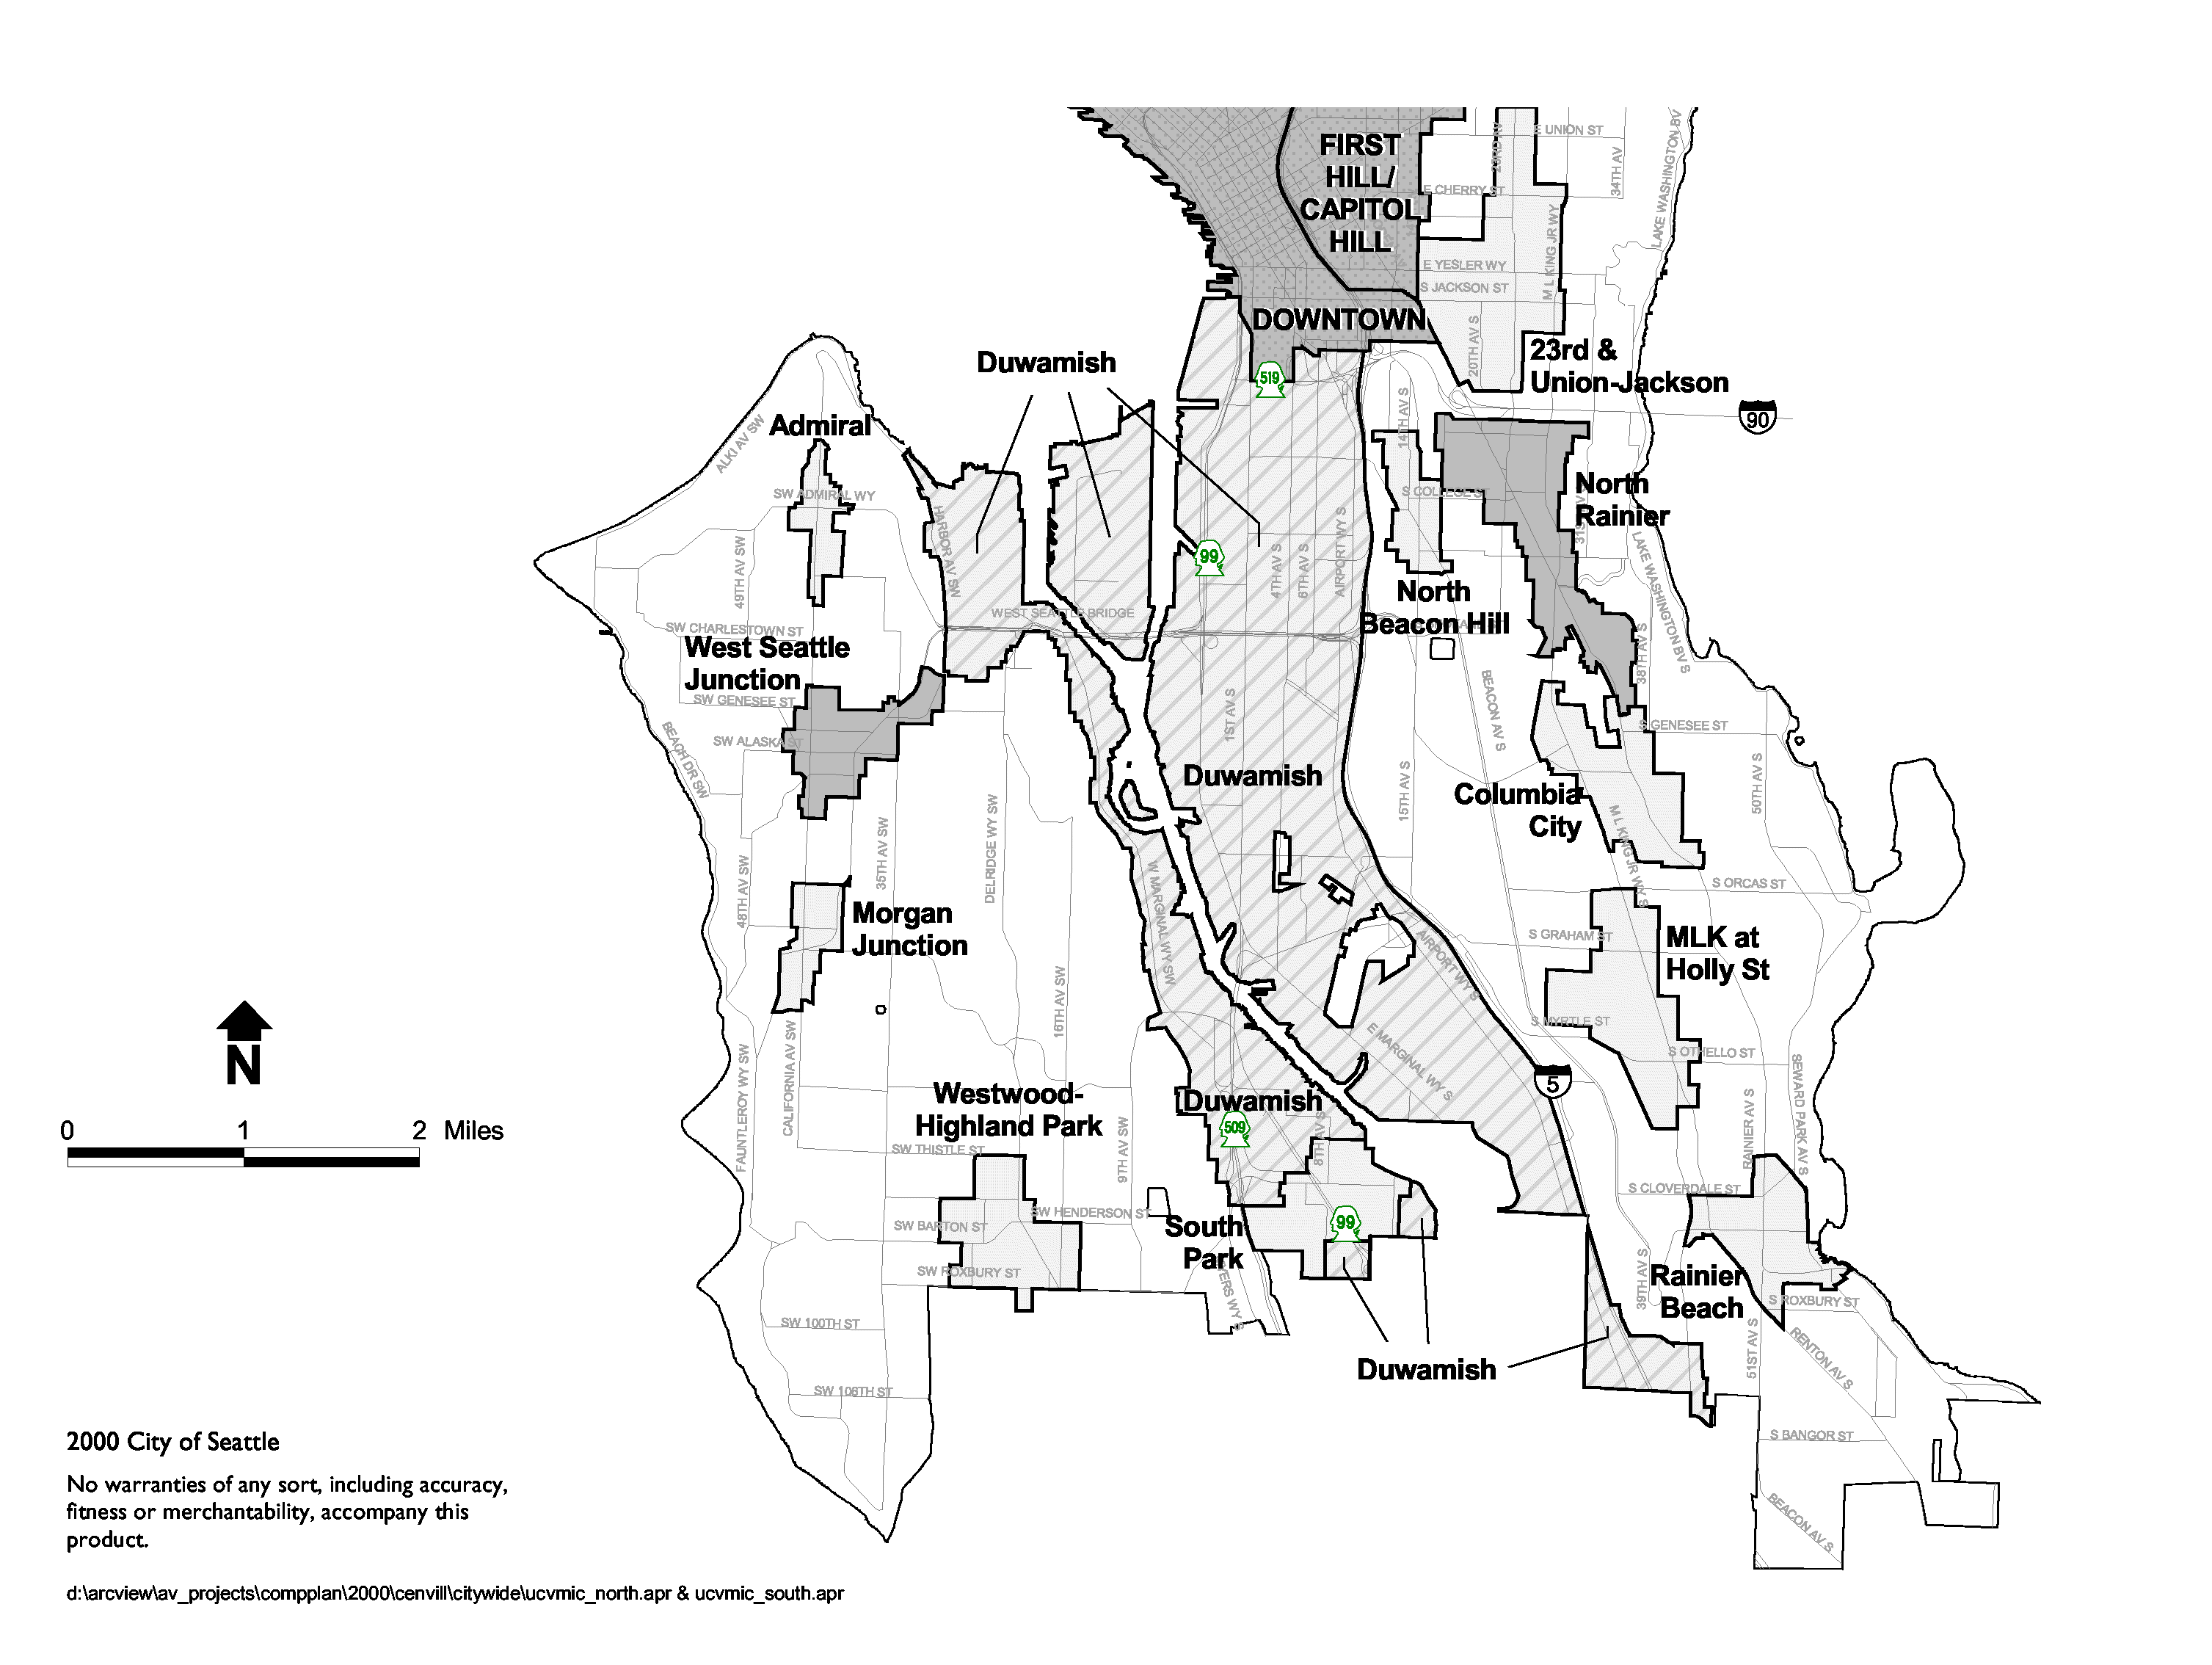
Unadopted Urban Center, Urban Village and Manufacturing/Industrial Centers Boundaries A2
LAND USE APPENDIX B
Growth Targets and Planning Estimates for Urban Center Villages, Hub Urban Villages, and Residential Urban Villages A4
LAND USE APPENDIX C
Cumulative Limits on Upzoning Land Zoned Single-family A9
LAND USE APPENDIX CD
Summary of Existing Land Use, Population, and Employment Characteristics A8
LAND USE APPENDIX E
Existing and Proposed Zoned Development Capacity A23
LAND USE APPENDIX DF
Growth Management Projections for the City of Seattle A20
LAND USE APPENDIX E
Open Space and Recreation Facility Goals A21
|
Growth Targets and Planning Estimates for Urban Centers, Center Villages, Hub Urban Villages, and Residential Urban Villages |
|||||||||||||||
|
Village |
Land |
Households (HH) |
Employment (Jobs) |
||||||||||||
|
Area in Acres |
Existing |
Existing Density (HH/ Acre) |
Growth Target or Planning Estimate1(HH Growth) |
Estimated 2010 Density |
Existing |
Existing Density (Jobs/ Acre) |
Growth Target or Planning Estimate1(Job Growth) |
Estimated 2010 Density |
|||||||
|
Urban Centers & Center Villages |
|||||||||||||||
|
Downtown Urban Center Total |
945 |
7,421 |
7.9 |
NA114,700 |
23.4 |
165,119 |
175 |
NA1 |
241 |
||||||
Belltown Village |
216 |
3,492 |
16.2 |
6,500 |
46.3 |
22,699 |
105 |
4,500 |
126 |
||||||
Denny Triangle Village |
143 |
514 |
3.6 |
3,500 |
28.1 |
22,010 |
154 |
23,600 |
319 |
||||||
Commercial Core Village |
275 |
1,435 |
5.2 |
1300 |
9.9 |
106,823 |
388 |
27,000 |
487 |
||||||
Pioneer Square Village |
142 |
376 |
2.6 |
2,1002 |
17.4 |
9,113 |
64 |
4,8002 |
98 |
||||||
Chinatown/International District Village |
169 |
1,604 |
9.5 |
1,300 |
17.2 |
4,474 |
26 |
2,800 |
43 |
||||||
|
First Hill/Cap. Hill Center Total |
912 |
21,673 |
23.8 |
NA1 |
30.0 |
33,393 |
37 |
NA1 |
50 |
||||||
First Hill Village |
225 |
5,896 |
26.2 |
2400 |
36.9 |
20,626 |
85 |
6,100 |
119 |
||||||
Capitol Hill Village |
396 |
12,450 |
31.4 |
1980 |
36.4 |
5,284 |
13 |
3,000 |
21 |
||||||
Pike/Pine Village |
131 |
2,349 |
18.0 |
620 |
22.7 |
3,963 |
30 |
1,400 |
41 |
||||||
12th Avenue Village |
160 |
978 |
6.1 |
540 |
9.5 |
3,520 |
22 |
1,200 |
30 |
||||||
|
Univ. Community Urban Center Total |
770 |
11,611 |
15.0 |
NA1 |
17.8 |
31,427 |
41 |
NA1 |
52 |
||||||
University Dist. NW Village |
289 |
4,324 |
14.9 |
1630 |
20.5 |
8,625 |
30 |
3,000 |
40 |
||||||
Ravenna Village |
122 |
973 |
8.0 |
480 |
12.0 |
1,580 |
13 |
700 |
19 |
||||||
University Campus Village |
359 |
6313 |
17.6 |
03 |
17.6 |
21222 |
59 |
4800 |
72 |
||||||
|
Northgate Urb. Center Total |
410 |
3,291 |
8.0 |
NA13,000 |
15.3 |
11,366 |
28 |
NA19,300 |
50 |
||||||
|
Uptown Queen Anne Urb. Center Total |
297 |
3,138 |
10.6 |
NA11,312 |
15.0 |
19000 |
64 |
NA1,3,300 |
75 |
||||||
|
Hub Urban Villages |
|||||||||||||||
Ballard |
323 |
4,279 |
13.2 |
1,520 |
17.9 |
3,518 |
11 |
3,700 |
22 |
||||||
Fremont4 |
339 |
3,766 |
11.1 |
750 |
13.5 |
6,937 |
20 |
1,700 |
25 |
||||||
Lake City4 |
310 |
2,740 |
8.8 |
1,400 |
13.3 |
2,827 |
9 |
2,900 |
18 |
||||||
W. Seattle Junction |
225 |
1,835 |
8.2 |
1,100 |
13.0 |
3,108 |
14 |
2,300 |
24 |
||||||
Bitter Lake Village4 |
344 |
2,271 |
6.6 |
1,260 |
10.3 |
4,027 |
12 |
,2800 |
20 |
||||||
North Rainier4 |
415 |
2,043 |
4.9 |
1,200 |
7.8 |
3,371 |
8 |
3,500 |
17 |
||||||
South Lake Union4 |
446 |
461 |
1.0 |
1,700 |
4.8 |
15,230 |
34 |
4,500 |
44 |
||||||
|
Residential Urban Villages |
|||||||||||||||
Aurora-Licton4 |
288 |
2,106 |
7.3 |
900 |
10.4 |
NA |
NA |
NA |
NA |
||||||
Greenwood/Phinney Ridge4 |
202 |
1,283 |
6.4 |
350 |
8.1 |
NA |
NA |
NA |
NA |
||||||
Upper Queen Anne4 |
103 |
1,063 |
10.3 |
300 |
13.2 |
NA |
NA |
NA |
NA |
||||||
Eastlake4 |
205 |
2,423 |
11.8 |
380 |
13.6 |
NA |
NA |
NA |
NA |
||||||
23rd Ave S @ S Jackson-Union4 |
485 |
3,186 |
6.6 |
900 |
8.4 |
NA |
NA |
NA |
NA |
||||||
Admiral District4 |
103 |
798 |
7.8 |
340 |
11.1 |
NA |
NA |
NA |
NA |
||||||
Green Lake |
107 |
1,439 |
13.4 |
400 |
17.2 |
NA |
NA |
NA |
NA |
||||||
Roosevelt |
160 |
1,007 |
6.3 |
340 |
8.4 |
NA |
NA |
NA |
NA |
||||||
Wallingford4 |
245 |
1,973 |
8.1 |
200 |
8.9 |
NA |
NA |
NA |
NA |
||||||
Rainier Beach |
227 |
1,482 |
6.5 |
740 |
9.8 |
NA |
NA |
NA |
NA |
||||||
Columbia City4 |
313 |
1,639 |
5.2 |
740 |
7.6 |
NA |
NA |
NA |
NA |
||||||
Westwood-Highland Park |
278 |
1,654 |
6.0 |
700 |
8.5 |
NA |
NA |
NA |
NA |
||||||
Beacon Hill4 |
171 |
1,844 |
10.8 |
550 |
14.0 |
NA |
NA |
NA |
NA |
||||||
Crown Hill |
173 |
929 |
5.4 |
310 |
7.2 |
NA |
NA |
NA |
NA |
||||||
MLK |
380 |
1,247 |
3.3 |
8005 |
5.4 |
NA |
NA |
NA |
NA |
||||||
South Park |
264 |
997 |
3.8 |
350 |
5.1 |
NA |
NA |
NA |
NA |
||||||
Madison-Miller |
145 |
1,486 |
10.3 |
400 |
13.0 |
NA |
NA |
NA |
NA |
||||||
Morgan Junction4 |
139 |
1,104 |
8.0 |
300 |
10.1 |
NA |
NA |
NA |
NA |
||||||
(Appendix B amended 7/95)
LAND USE ELEMENT APPENDIX B
(Continued)Footnotes
1
2
Assumes north Kingdome parking lot and vacant floor area in existing structures is available to accommodate a substantial share of household and employment growth.3
4
The6
Because of theGrowth planning estimates for areas outside of urban villages and centers are as follows:
1. Residential growth:
A. In areas within a quarter mile radius surrounding all neighborhood anchors: 6,000 households
B. In the areas beyond a quarter mile radius surrounding all neighborhood anchors: 9,000 households
2. Employment growth: No specific planning estimate. Areas outside of villages and centers are to share some portion of the 14,660 jobs not estimated for center or hub urban villages, at appropriate development intensities, where current zoning allows, including existing major institutions, industrial areas located outside designated Manufacturing/Industrial Centers, and commercial areas.
Cumulative Limits on Upzoning Land Zoned Single-family
That Meets Land Use Code Locational Criteria for a Single-family Designation
Village/Center Acres
Northgate 4.2
University District
Northwest 4.7
University village 0
UW Campus .4
Seattle Center 0
Downtown
Denny Regrade 0
Westlake 0
Commercial Core 0
Pioneer Square 0
International District 1
First Hill/Capitol Hill
Capitol Hill 0
Pike/Pine 0
First Hill 0
South Capitol Hill 0
Aurora 130th 31.9
Lake City 77.5
West Seattle Junction 52.3
Fremont 9.2
Ballard 0
Rainier/I90 126.5
South Lake Union 0
Aurora 97th 57.8
Greenwood 131.6
Crown Hill 106.9
Upper Queen Anne 28.8
Eastlake 19.5
23rd Ave. S/S Jackson 157
Beacon Hill 56.4
Columbia City 84.5
Admiral @ California 57.1
MLK & S Holly 116.6
SW Barton St @ 25th SW 141.9
South Park 209.3
21st Ave E./ E Madison 38.1
Green Lake 11.4
Roosevelt 95.3
Wallingford 132.3
Rainier Beach 69.2
California/ SW Morgan 88.3
LAND USE APPENDIX D
Summary of Existing Land Use, Population, and
Employment Characteristics
This section describes the existing arrangement and concentration of uses and activities such as housing, businesses, parks and industries. Detailed discussion of the natural features, platting pattern, transportation facilities and the development pattern is provided in the Draft Comprehensive Plan Land Use Element, published in April 1993.
Land Uses
Seattle encompasses approximately 53,813 acres or about 84 square miles. Land Use Figure A-2 illustrates how the city’s land area is distributed among different types of uses. About 40% of the total land area is occupied by residential uses, most of which is in single-family development. Street rights-of-way take up the next largest amount of land -- almost 26%. Commercial and industrial areas, where most of the jobs in the city are located, occupy about 10%, while public parks account for approximately 9%.
Land Use Figure A-3 illustrates how these various activities are distributed within the city. With the exception of the downtown area and its immediate surroundings, Seattle is predominantly covered by single-family houses and street right-of-way. Most multifamily residences are concentrated in core areas such as First Hill/Capitol Hill and the University District. Jobs are located primarily in commercial and industrial areas such as Downtown, Duwamish, Northgate and the University District.
Types of Housing
Slightly over half of the city’s households are living in detached, single-family houses that occupy 34% of the city’s total land area. Most of these dwellings are located in areas devoted exclusively to low-density development (Land Use Figure A-4). The other half of the city’s households live in some type of multifamily development concentrated on 6% of the city's land area. These multifamily dwellings are in buildings of varying sizes, including small buildings of two to four units (duplexes, triplexes and four-plexes), medium-sized buildings (apartment buildings and condominiums with 10 to 19 units), and large buildings (apartment buildings and condominiums with 20 units or more). Citywide, small multifamily buildings of two to four units account for very little of Seattle’s housing. Most of the city’s multifamily units are in large buildings.
HOUSING AND POPULATION DENSITY
Land Use Figure A-5 shows the distribution of household density in the city expressed as the number of households per gross acre. (Gross acre includes nonresidential uses such as street rights-of-way and parks.) Areas with the highest density of households (hh) are located north of the I-90 freeway. Portions of First Hill/Capitol Hill contain the highest density of households -- in some areas well over 13 hh/gross acre. The next densest areas (11-13 hh/gross acre) include portions of the Denny Regrade, the south slope of Queen Anne Hill and a portion of the University District. Areas of more moderate housing unit density (8-10 hh per gross acre) include West Seattle Junction, Ballard, Wallingford, Eastlake and Madison Park. A population density map (Land Use Figure A-6) is another way of presenting information about where people live. This figure shows a concentration of residents similar to that of the household density map. In addition, it shows isolated areas where a significant concentration of people occur, such as the Highpoint and Holly Park communities.
Land Use Figure A-2AMOUNT OF LAND AREA BY LAND USE BY DISTRICTS
(in Acres)
|
DISTRICT |
Single Family |
Multi- family |
Commercial |
Industrial |
Transport/Comm/Util* |
Parks ** |
Other *** |
Rights-of-Way **** |
Vacant |
Total |
|
Ballard |
1,544.8 |
249.3 |
259.6 |
147.1 |
38.6 |
117.3 |
175.5 |
958.0 |
132.1 |
3,622.3 |
|
Capitol Hill |
661.7 |
272.9 |
144.1 |
14.8 |
12.8 |
333.3 |
240.7 |
654.8 |
90.0 |
2,425.1 |
|
Central |
697.5 |
244.0 |
86.9 |
26.0 |
4.0 |
143.2 |
191.7 |
570.0 |
179.6 |
2,142.9 |
|
Downtown |
0.4 |
42.9 |
383.4 |
27.7 |
25.4 |
18.1 |
207.3 |
302.7 |
13.1 |
1,021.0 |
|
Duwamish |
1,299.3 |
153.5 |
510.8 |
1,247.3 |
691.3 |
312.9 |
860.6 |
2,137.1 |
702.4 |
7,915.2 |
|
Lake Union |
495.3 |
230.3 |
148.4 |
73.2 |
17.7 |
472.3 |
113.8 |
592.7 |
51.3 |
2,195.0 |
|
North |
1,803.7 |
242.5 |
265.4 |
14.8 |
16.4 |
233.2 |
170.8 |
924.0 |
110.1 |
3,780.9 |
|
Northeast |
2,365.8 |
333.5 |
200.0 |
13.6 |
12.6 |
371.5 |
537.3 |
1,760.4 |
113.4 |
5,708.1 |
|
Northwest |
2,602.2 |
388.4 |
258.8 |
13.7 |
13.2 |
307.5 |
347.3 |
1,571.9 |
229.0 |
5,732.0 |
|
Queen Anne |
1,415.3 |
389.8 |
232.6 |
191.4 |
398.0 |
870.1 |
67.0 |
1,142.2 |
147.5 |
4,853.9 |
|
Southeast |
1,951.4 |
181.1 |
122.0 |
46.4 |
10.9 |
658.3 |
200.0 |
1,121.5 |
337.4 |
4,629.0 |
|
West Seattle |
3,627.9 |
445.2 |
217.9 |
795.9 |
199.9 |
973.4 |
200.0 |
2,296.3 |
1,031.6 |
9,788.1 |
|
Citywide Totals |
18,465.3 |
3,173.4 |
2,829.9 |
2,611.9 |
1,440.8 |
4,811.1 |
3,312.0 |
14.031.6 |
3,137.5 |
53,813.5 |
Sources: King County Assessors Files, 1991; Seattle Planning Department GIS, 1993
*Transportation, Communications, and Utilities *** e.g., Cemeteries and Reservoirs
**Publicly-owned parks and dedicated open space **** Platted Streets and Sidewalks
GENERALIZED*
EXISTING LAND USE
Note: Figure A-3, Generalized Existing Land Use, is omitted from this attachment because no amendments are proposed for Figure A-3; it is retained without amendment.
Land Use Figure A-4
NUMBER OF UNITS BY HOUSING TYPE BY DISTRICTS
(in Dwelling Units)
|
DISTRICT |
Single Family |
Duplex |
Triplex/ Four-plex |
5 to 9 unit Building |
10 to 19 unit Building |
20 to 49 unit Building |
50 or more units |
Mobile Home |
Other |
Total Units |
|
Ballard |
12,990 |
1,433 |
1,346 |
1,939 |
1,461 |
1,080 |
310 |
8 |
273 |
20,567 |
|
Capitol Hill |
5,393 |
550 |
910 |
1,696 |
4,439 |
7,349 |
5,027 |
3 |
283 |
25,640 |
|
Central |
6,621 |
1,029 |
922 |
952 |
1,307 |
1,529 |
610 |
16 |
135 |
13,269 |
|
Downtown |
56 |
32 |
80 |
236 |
524 |
2,554 |
5,237 |
3 |
210 |
8,857 |
|
Duwamish |
9,396 |
1,002 |
853 |
605 |
1,037 |
700 |
302 |
57 |
143 |
14,162 |
|
Lake Union |
5,580 |
1,041 |
1,180 |
2,273 |
2,377 |
1,113 |
69 |
8 |
471 |
13,784 |
|
North |
9,881 |
271 |
433 |
855 |
1,264 |
1,704 |
2,421 |
35 |
146 |
17,335 |
|
Northeast |
17,376 |
874 |
1,348 |
1,675 |
2,573 |
2,901 |
1,239 |
80 |
244 |
28,212 |
|
Northwest |
17,594 |
1,149 |
1,231 |
1,727 |
2,796 |
2,382 |
1,494 |
442 |
237 |
29,059 |
|
Queen Anne |
11,510 |
1,235 |
1,614 |
2,405 |
3,525 |
5,391 |
1,268 |
13 |
334 |
27,198 |
|
Southeast |
12,134 |
555 |
550 |
651 |
994 |
930 |
699 |
9 |
166 |
16,856 |
|
West Seattle |
23,799 |
1,320 |
1,683 |
1,622 |
2,123 |
2,596 |
544 |
20 |
220 |
33,873 |
|
Citywide Totals |
132,300 |
10,491 |
12,150 |
16,636 |
24,420 |
30,229 |
19,220 |
694 |
2,862 |
249,032 |
Source: 1990 US Census
Land Use Figure A-5
1990 Household Density
Note: Figure A-5, 1990 Household Density, is omitted from this attachment because no amendments are proposed for Figure A-5; it is retained without amendment.
Land Use Figure A-6
1990 Population Density
Note: Figure A-6, 1990 Population Density, is omitted from this attachment because no amendments are proposed for Figure A-6; it is retained without amendment.
Employment Activity
Seattle is a regional employment center providing a great variety of jobs. Based on PSRC 1990 data, Seattle contains about 469,802 jobs in businesses occupying about 5,442 commercial and industrial acres, or 10% of the total city land area. Land Use Figure A-7 shows the distribution of these jobs according to standard classifications by neighborhood districts.
Employment Densities
Land Use Figure A-8 illustrates the distribution of employment density as number of jobs per gross acre. Areas with the highest job densities (greater than 50 jobs/gross acre) include Downtown, First Hill, Seattle Center and South Lake Union communities. Areas with a fairly high density (26 to 50 jobs/gross acre) are the University District, Ballard and Central areas. Predominantly residential areas of the city have employment densities as low as 1 to 15 jobs per acre.
Major Employment Concentrations
Employment activity is much more concentrated than housing. Most of the jobs in the city are located in the areas described below. These areas are unique because they attract people daily from all over the city and region.
Downtown. Downtown Seattle, with about 165,000 jobs at an average density of about 175 jobs per gross acre, supports the largest concentration of jobs in the Pacific Northwest. In some parts of the office core, job densities exceed 300 jobs per acre. Almost 37% of the total number of jobs in the city are located downtown.
University District. University District, with over 31,500 jobs, has the second greatest concentration of employment within the city. While much of this employment is associated with the University of Washington, the largest single employer in the city, the area also has significant amounts of both service and retail employment. Employment density in the University District is about 40 jobs per acre.
Northgate. In addition to Northgate Mall, the city’s principal regional shopping facility outside of downtown, several major employers are clustered in the Northgate area, including Northwest Hospital, North Seattle Community College and a relatively large concentration of service employment. This area has a total employment of about 11,366 jobs, at a density of about 28 jobs per acre.
Seattle Center. Another substantial concentration of employment located immediately north of downtown is the area around Seattle Center between Denny Way and the base of Queen Anne Hill. Providing backup office and service activity for downtown, as well as other retail and service uses, the area accommodates over 33,000 jobs at a job density of around 37 jobs per acre.
First Hill. A very specialized concentration of medical facilities has developed on First Hill east of downtown, lending the area the nickname "Pill Hill." With Swedish Hospital Medical Center, Virginia Mason Medical Center, Harborview Medical Center and related support facilities, this area has one of the greatest employment concentrations in the city, with around 20,000 jobs at an average employment density of about 85 jobs per acre.
Major Institutions. A number of major institutions located throughout the city also provide significant concentrations of employment for the whole region, such as the University of Washington. Others are somewhat isolated concentrations of employment in otherwise low-density areas, such as Veterans Administration Medical Center and South Seattle Community College.
Neighborhood Commercial. Seattle’s neighborhood business areas provide locations for services needed by the surrounding low- to moderate-residential populations, such as food from restaurants or grocery stores; entertainment; professional, personal or business services. These neighborhood businesses are dispersed and the range of services they provide varies throughout the city. They generally are in locations with fair accessibility to both the transportation network and concentrations of people.
A number of the city’s larger, more-established neighborhood commercial areas also provide concentrations of employment. Ballard, Fremont, and West Seattle Junction are all areas with between 3,000 and 6,000 jobs and employment densities averaging in the 10 to 20 jobs per acre range. Other commercial areas with notable job concentrations include Lake City, the Aurora strip between N. 125th and N.145th Streets and the area around Rainier Avenue and Interstate 90. The employment populations of these areas range between 3,000 and 4,000, with average job densities of between 8 to 12 jobs per acre. South Lake Union, in close proximity to Downtown, has over 15,000 jobs, reaching an employment density of 34 jobs per acre.
Industrial Areas. Citywide, industrial uses are concentrated in the Duwamish Valley, and North Seattle, which includes Interbay, and the shoreline area between Ballard and Fremont. Some manufacturing and industrial activity also occurs around the shores of Lake Union and along Rainier Avenue, near Interstate 90. Two of these areas, North Seattle and the Duwamish Valley, are major areas of employment. The North Seattle area has roughly 15,000 jobs, while the Duwamish accounts for over 65,000. Combined, they contain roughly 17% of the city’s total employment population. Given the land-intensive nature of employment activities in these areas, the job densities are comparatively low, seldom exceeding 14 jobs per acre.
Land Use Figure A-7
1990 EMPLOYMENT BY DISTRICTS
|
DISTRICT |
Retail |
F.I.R.E.* |
Government |
Education |
W.C.T.U.** |
Manufacturing |
Total |
|
Ballard |
3,837 |
4,480 |
757 |
216 |
2,127 |
3,110 |
14,527 |
|
Capitol Hill |
3,716 |
23,100 |
6,063 |
111 |
931 |
701 |
34,622 |
|
Central |
971 |
12,219 |
1,039 |
214 |
897 |
1,931 |
17,271 |
|
Downtown |
21,427 |
91,004 |
30,261 |
0 |
24,525 |
7,819 |
175,036 |
|
Duwamish |
5,054 |
11,453 |
11,720 |
223 |
24,426 |
17,868 |
70,744 |
|
Lake Union |
2,758 |
9,307 |
441 |
52 |
1,368 |
2,666 |
16,592 |
|
North |
5,239 |
7,839 |
380 |
215 |
649 |
302 |
14,623 |
|
Northeast |
6,421 |
11,681 |
22,318 |
242 |
698 |
610 |
41,970 |
|
Northwest |
4,614 |
9,324 |
1,748 |
255 |
1,078 |
697 |
17,716 |
|
Queen Anne |
4,762 |
17,048 |
4,149 |
437 |
8,654 |
4,658 |
39,708 |
|
Southeast |
1,803 |
2,266 |
1,022 |
379 |
778 |
1,566 |
7,814 |
|
West Seattle |
4,211 |
4,557 |
997 |
376 |
3,127 |
5,911 |
19,179 |
|
Citywide Totals |
64,813 |
204,277 |
80,895 |
2,720 |
69,258 |
47,839 |
469,802 |
Source: Puget Sound Regional Council, Nov. 1993
*F.I.R.E. - Finance, Insurance, and Real Estate
**W.C.T.U. - Wholesale, Communications, Transportation, and Utilities
Land Use Figure A-8
Employment Density by
1990 Census Tract
Note: Figure A-8, Employment Density by 1990 Census Tract , is omitted from this attachment because no amendments are proposed for Figure A-8; it is retained without amendment.
Employment Distribution by Employment Sector
The distribution of jobs by employment sector in Seattle is shown in Land Use Figure A-9. Between 1980 and 1990, the number of jobs in Seattle increased by 21%, (83,118 new jobs). Service jobs accounted for the biggest increases, while manufacturing jobs have decreased by more than 5%.
LAND USE FIGURE A-9:
DISTRIBUTION OF JOBS BY EMPLOYMENT SECTOR
EMPLOYMENT SECTOR*
1980 % SHARE 1990 % SHARE % CHANGE
Mfg 50,536 13.1 47,839 10.0 -5
Retail 61,218 15.8 64,813 13.8 +6
WCTU 60,326 15.6 69,258 14.7 +15
FIRE/Serv 137,358 35.5 204,277 43.5 +49
Govt/Educ 77,246 20.0 83,615 17.8 +8
TOTAL 386,684 469,802 +21
Source: Forecasts of Seattle’s Population, Household, and Employment Characteristics for the Comprehensive Plan EIS Analysis, Seattle Planning Department, September 1992.
* Mfg = Manufacturing
WCTU = Wholesale, trade, transportation, communications, utilities
FIRE/Serv = Finance, insurance, real estate, services
Govt/Educ = Government, Education
LAND USE APPENDIX E:
Existing and Proposed Zoned Development Capacity
Summary
This appendix is an update of the Zoned Development Capacity report published by the Planning Department (formerly Office for Long-range Planning) in November 1991. Basic assumptions developed for the 1991 Capacity report are incorporated into this updated capacity analysis. This analysis provides a current calculation of zoned development capacity by using current existing conditions data and updated zoning.
Two sets of residential and non-residential estimated capacity calculations are presented. The first capacity calculations present the estimated development potential under existing zoning (Capacity I). A second set of capacity calculations (Capacity II) presents changes to estimated development capacity to reflect the proposed changes to zoning and development standards required to implement the Urban Village Strategy.
Definition. Development capacity is an amount of residential development (number of dwelling units) and non-residential development (building floor area) that could be built based on the zoning of the land and other factors limiting development. Generally, capacity is calculated by assuming a certain development is permitted based on allowable density as defined by the zoning. Other factors are considered such as the extent of existing development, existing uses, public ownership and the presence of streets, parks and greenbelts. Estimates do not take into account many factors which will influence actual development decisions, such as site constraints, availability of financing, and consumer demand or the capacity of the infrastructure, including roads and utilities. However, consideration has been given to the likelihood of redevelopment based on existing improvements to the site.
Data Source. The primary data source for calculating capacity is the King County Department of Assessor's property records on existing conditions including number of units and assessed valuation. City of Seattle Geographic Information System data were used for land area and zoning data.
CAPACITY METHODOLO of selecting parcels is the same. The following lists the areas with different assumptions incorporated as part of the capacity II analysis.
• Applied proposed residential density limits to mixed-use development in commercial zones located outside Urban Villages and to C-1 zones inside of urban villages. Additional capacity was calculated for C-1 zones inside villages based on the new option to build to NC3 standards, but not included in Land Use Figure A-13 below (see footnotes);
• Applied a proposed floor area ratio to office uses in all general commercial zones located inside and outside of Urban Villages (Additional office capacity was calculated for general commercial zones inside villages based on the option to build to NC-3 standards, but not included in Land Use Figure A-14 (see footnotes);
• Parcels in all commercial zones except C-2 were divided, with 50 percent allocated to housing and 50 percent allocated to non-residential square footage. Parcels in C-2 zones were all allocated to non-residential use;
• Capacity of approximately 57 acres of Lowrise 3 land was reduced by 500 units to reflect recommended rezoning;
• Parcels in the Northgate Comprehensive Plan area and Southeast Seattle Redevelopment Area were assumed to develop according to provisions in those plans;
• In the Pike/Pine area, some NC3 zoned land was assumed to be rezoned to the new NC/R classification, which would increase the amount of residential development allowed in single-use residential buildings and decrease the amount of non-residential capacity. Three-quarters of such parcels were assigned residential uses and one-quarter non-residential.
Several of the assumptions of this analysis serve to understate actual capacity, providing a margin for error to assure that sufficient capacity exists:
a. No additional residential capacity above the proposed base density limit is assumed for the C-1 zones in urban villages, where a greater density limit is permitted if neighborhood commercial development and use standards are followed;
b. It is assumed that no residential development will take place in C-2 zones where residential use is a conditional use. However, in villages mixed-use is to be encouraged and C-2, like C-1 can be developed conditionally to neighborhood commercial residential densities;
c. The typical jobs per acre ratio for industrial uses is assumed for development of industrial land, although some commercial uses with a higher jobs per acre ratio are allowed.
Land Use Figure A-13 compares the estimated existing housing capacity (Capacity I) with the estimated comprehensive plan housing capacity (Capacity II) reflecting the urban village strategy. Capacity II shows an estimated decrease in capacity of about 8%, about 8,560 housing units under the most limiting assumptions. If developers take
advantage of the option to develop C-1 or C-2 zoned property to neighborhood commercial zone standards in urban villages up to 3,950 more dwelling units could be added under comprehensive plan capacity.
Land Use Figure A-13
Comparison of Estimated Potential Units
Under Existing and Proposed Urban Village Strategy by Zoning Category
|
|
Capacity I (Existing Zoning) |
Capacity II (Comprehensive Plan Zoning) |
|
Single-Family |
13,160 |
13,160 |
|
Multifamily |
46,680 |
46,180 |
|
Commercial |
29,360 |
21,300 |
|
Downtown |
24,440 |
24,440 |
|
Total |
113,640 |
105,080 |
Source: Calculations by Seattle Planning Department, 1994
Land Use Figure A-14 compares the estimated Capacity I non-residential floor area with the estimated adjusted and Capacity II floor area reflecting the Urban Village strategy. As above Capacity II estimates show the revised capacity assuming regulations anticipated under the comprehensive plan. An estimated 8.7 million fewer square feet could be added under the Capacity II assumptions, in commercial zones than under existing capacity, using limiting assumptions. If the option to develop land zoned C-1 or C-2 to neighborhood commercial zone standards within urban villages is used, up to an additional 8.7 million square feet could be built, accommodating about 29,000 additional jobs.
Land Use Figure A-14
Comparison of Estimated Potential Floor Area (jobs)
Under Existing and Proposed Urban Village Strategy by Zoning Category
|
|
Capacity I (Existing Zoning) |
Capacity II (Comprehensive Plan Zoning) |
|
Commercial |
46.2 (154,000 jobs) |
27.9 (93,000 jobs) |
|
Downtown |
28.0 (101,700 jobs) |
28.0 (101,700 jobs) |
|
Industrial |
39.2 (87,000 jobs) |
39.2 (87,000 jobs) |
|
Total |
113.4 (342,700 jobs) |
95.1 (281,700 jobs) |
* Number of potential jobs is calculated using the following floor area to employee ratio: Commercial zones at 300 sq ft/employee, Downtown zoned at 275 sq ft/employee, and Industrial zones at 450 sq ft/employee.
LAND USE APPENDIX DF
Growth Management Projections for the City of Seattle
(Adopted 7/96)
The following annual population and employment projections reflect the City’s 20 year population and employment growth assumptions. These figures are projections, or what is predicted to occur over the life of the Plan. Growth estimates reflect Washington State estimates of actual housing growth as of April 1 of each year. These figures will be revised periodically to reflect changes in assumptions and/or actual growth.
Resident
Population|
Year |
Resident Projected Population |
Estimated Population |
Projected Households |
Estimated Housing Units |
Average Household Size |
Projected Employment |
||
|
1994 |
527,200 |
531,400 |
245,400 |
259,000 |
2.06 |
549,400 |
||
|
1995 |
526,900 |
532,900 |
246,300 |
259,900 |
2.05 |
554,600 |
||
|
1996 |
527,600 |
534,700 |
247,600 |
260,900 |
2.04 |
560,400 |
||
|
1997 |
528,400 |
536,600 |
249,000 |
262,000 |
2.04 |
568,000 |
||
|
1998 |
529,900 |
539,700 |
250,900 |
264,400 |
2.03 |
576,800 |
||
|
1999 |
532,200 |
540,500 |
253,100 |
266,100 |
2.02 |
586,400 |
||
|
2000 |
536,000 |
540,900 |
256,100 |
269,100 |
2.01 |
597,400 |
||
|
2001 |
541,100 |
260,100 |
2.00 |
607,000 |
||||
|
2002 |
546,200 |
264,000 |
1.98 |
616,000 |
||||
|
2003 |
549,800 |
267,000 |
1.98 |
623,700 |
||||
|
2004 |
552,700 |
269,600 |
1.97 |
629,100 |
||||
|
2005 |
556,000 |
272,300 |
1.96 |
634,200 |
||||
|
2006 |
559,600 |
275,400 |
1.95 |
640,300 |
||||
|
2007 |
564,600 |
279,100 |
1.94 |
647,100 |
||||
|
2008 |
569,400 |
282,900 |
1.93 |
654,100 |
||||
|
2009 |
573,700 |
286,400 |
1.92 |
661,100 |
||||
|
2010 |
578,100 |
289,800 |
1.91 |
668,100 |
||||
|
2011 |
582,600 |
293,400 |
1.91 |
674,300 |
||||
|
2012 |
587,400 |
297,100 |
1.90 |
681,100 |
||||
|
2013 |
592,600 |
301,200 |
1.89 |
688,700 |
||||
|
2014 |
598,400 |
305,700 |
1.88 |
696,900 |
Sources: Growth Management Act Projections for the City of Seattle; Dick Conway and Associates, October 1993
April 1 Population of Cities, Towns, and Counties Used for the Allocation of Designated State Revenues; State of Washington, Office of Financial Management, Forecasting Division, June 2000
Total Housing Units 1990 through 2000; State of Washington, Office of Financial Management, Forecasting Division, July 2000
APPENDIX E:
City Open Space and Recreation Facility Goals
|
City Open Space |
Goal |
Area |
|
Breathing Room Open Space |
1 Acre per 100 residents |
Citywide |
|
Usable Open Space |
¼ to ½ acre within ¼ to ½ mile of every resident |
Areas outside Urban Villages |
|
Recreation Facilities |
Specific Goals for Recreation Facilities such as Community Centers, swimming pools and athletic fields are contained in the Parks Comprehensive Plan |
Citywide, except as modified by Village Open Space and Recreation Goals |
URBAN VILLAGE OPEN SPACE AND RECREATION FACILITY GOALS
|
Goal |
Urban Center Villages |
Hub Urban Villages |
Residential Urban Villages |
|
Urban Village Open Space Population-based Goals |
One acre of Village Open Space per 1,000 households. For the downtown core one acre of Village Open Space per 10,000 jobs. |
One acre of Village Open Space per 1,000 households. |
Same as for Hub Urban Villages. |
|
Urban Village Open Space Distribution Goals |
All locations in the village within approximately 1/8 mile of Village Open Space. |
Same as for Urban Center Villages. |
For moderate and high density areas: All locations within 1/8 mile of a Village Open Space that is between 1/4- and 1-acre in size, or within 1/4 mile of a Village Open Space that is greater than 1 acre. For low density areas: All locations within 1/4 mile of any qualifying Village Open Space. |
|
Qualifying Criteria for Village Open Space |
Dedicated open spaces of at least 10,000 square feet in size, publicly accessible, and usable for recreation and social activities. |
Same as for Urban Center Villages. |
Same as for Urban Center and Hub Villages. |
|
Village Commons, Recreation Facility and Community Garden Goals |
At least one usable open space of at least one acre in size (Village Commons) where the existing and target households total 2,500 or more. (Amended 11/96) One indoor, multiple-use recreation facility serving each Urban Center. One dedicated community garden for each 2,500 households in the Village with at least one dedicated garden site. |
At least one usable open space of at least one acre in size (Village Commons). One facility for indoor public assembly. Same as for Urban Center Villages. |
At least one usable open space of at least one acre in size (Village Commons) where overall residential density is 10 households per gross acre or more. One facility for indoor public assembly in Villages with greater than 2,000 households. Same as for Urban Center and Hub Villages. |